
1. Prometheus是什么
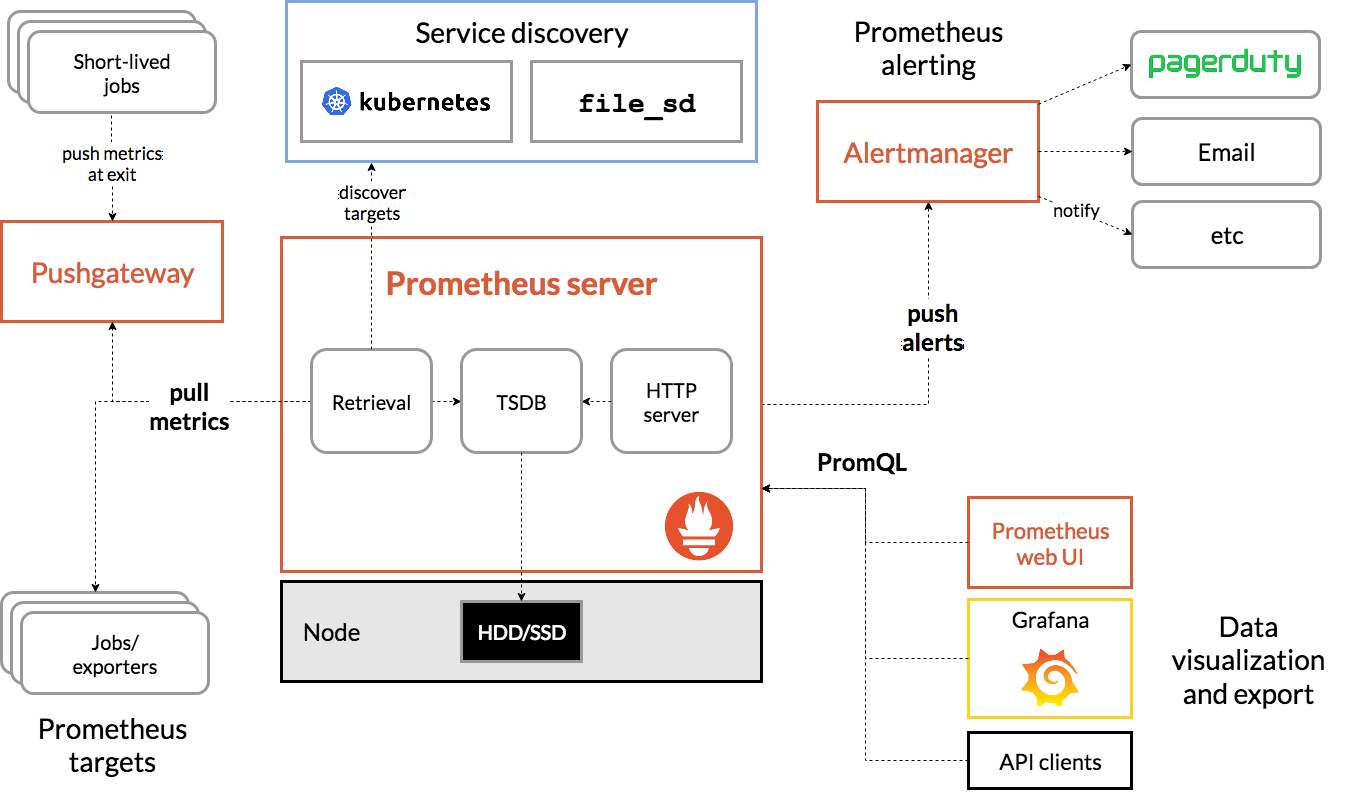
Prometheus是一个具有活跃生态系统的开源系统监控和告警工具包。一言以蔽之,它是一套开源监控解决方案。
Prometheus主要特性:
- 多维数据模型,其中包含由指标名称和键/值对标识的时间序列数据
- PromQL,一种灵活的查询语言
- 不依赖分布式存储; 单服务器节点是自治的
- 时间序列收集通过HTTP上的pull模型进行
- 通过中间网关支持推送(push)时间序列
- 通过服务发现或静态配置发现目标
- 支持多种模式的图形和仪表盘
为什么用pull(拉取)而不用push(推送)呢?
因为,pull有以下优势:
- 进行更改时,可以在笔记本电脑上运行监控
- 可以更轻松地判断目标是否下线
- 可以手动转到目标并使用Web浏览器检查其运行状况
目标暴露HTTP端点,Prometheus服务端通过HTTP主动拉取数据。既然是服务端自己主动向目标拉取数据,那么服务端运行在本地(我们自己的电脑上)也是可以的,只要能访问目标端点即可,同时就像心跳检测一样可以判断目标是否下线,还有,服务端自己主动拉取,那么想拉取谁的数据就拉取谁的数据,因而可以随意切换拉取目标。
回想一下Skywalking是怎么做的,SkyWalking有客户端和服务端,需要在目标服务上安装探针(agent),探针采集目标服务的指标数据,上报给服务端OAP服务,这个对目标有一定的侵入性,不过可以接受。Prometheus不需要探针,可以借助push gateway来实现push效果。
对了,有个名词要先说清楚,metrics (译:度量,指标),个人更倾向于把它翻译成指标,后面说指标就是metrics
2. 基本概念
2.1. 数据模型
Prometheus基本上将所有数据存储为时间序列:具有时间戳的值流,它们属于同一个指标和同一组标记的维度。除了存储的时间序列外,Prometheus还可以生成临时派生的时间序列作为查询的结果。
Metric names and labels
Every time series is uniquely identified by its metric name and optional key-value pairs called labels.
每个时间序列都由它的指标名称和称为标签的可选键/值对唯一标识。
样本构成实际的时间序列数据。 每个样本包括:
- 一个64位的浮点值
- 一个毫秒时间戳
给定指标名称和一组标签,时间序列通常使用这种符号来标识:
<metric name>{<label name>=<label value>, ...}
例如,有一个时间序列,指标名称是api_http_requests_total,标签有method="POST"和handler="/messages",那么它可能被表示成这样:
api_http_requests_total{method="POST", handler="/messages"}
2.2. 指标类型
Counter
counter是一个累积量度,代表一个单调递增的计数器,其值只能增加或在重新启动时重置为零。例如,可以使用计数器来表示已服务请求数,已完成任务或错误的数量。
不要使用计数器来显示可以减小的值。例如,请勿对当前正在运行的进程数使用计数器,代替的应该使用量规。
Gauge
量规是一种指标,代表可以任意上下波动的单个数值。
量规通常用于测量值,例如温度或当前内存使用量,还用于可能上升和下降的“计数”,例如并发请求数。
Histogram
直方图对观察结果(通常是请求持续时间或响应大小)进行抽样,并在可配置的桶中对它们进行计数。它还提供了所有观测值的总和。
一个基础指标名称为<basename>的直方图在抓取期间会暴露多个时间序列:
- 观察桶的累积计数器,表示为 <basename>_bucket{le="<upper inclusive bound>"}
- 所有观测值的总和,表示为 <basename>_sum
- 观察到的事件数量,表示为 <basename>_count
Summary
与直方图类似,摘要对观察结果(通常是请求持续时间和响应大小等内容)进行抽样分析。虽然它还提供了观测值的总数和所有观测值的总和,但它可以计算滑动时间窗口内的可配置分位数。
一个基础指标名称为<basename>的摘要在抓取期间暴露多个时间序列:
- 观察桶的累积计数器,表示为 <basename>_bucket{le="<upper inclusive bound>"}
- 所有观测值的总和,表示为 <basename>_sum
- 观察到的事件数量,表示为 <basename>_count
2.3. 作业和实例
在Prometheus的术语中,可以抓取的端点称为实例,通常对应于单个进程。具有相同目的的实例集合,称为作业。
例如,一个作业有四个实例:
job: api-server
instance 1: 1.2.3.4:5670
instance 2: 1.2.3.4:5671
instance 3: 5.6.7.8:5670
instance 4: 5.6.7.8:5671
当Prometheus抓取目标时,它会自动在抓取的时间序列上附加一些标签,以识别被抓取的目标:
- job:目标所属的已配置的作业名称
- instance:被抓取的目标URL的<host>:<port>部分
3. 安装与配置

Prometheus通过抓取指标HTTP端点从目标收集指标。由于Prometheus以相同的方式暴露自己的数据,因此它也可以抓取并监视其自身的健康状况。
默认情况下,不用更改配置,直接运行就可以抓取prometheus自身的健康状况数据
# Start Prometheus.
# By default, Prometheus stores its database in ./data (flag --storage.tsdb.path)

./prometheus --config.file=prometheus.yml
直接访问 localhost:9090

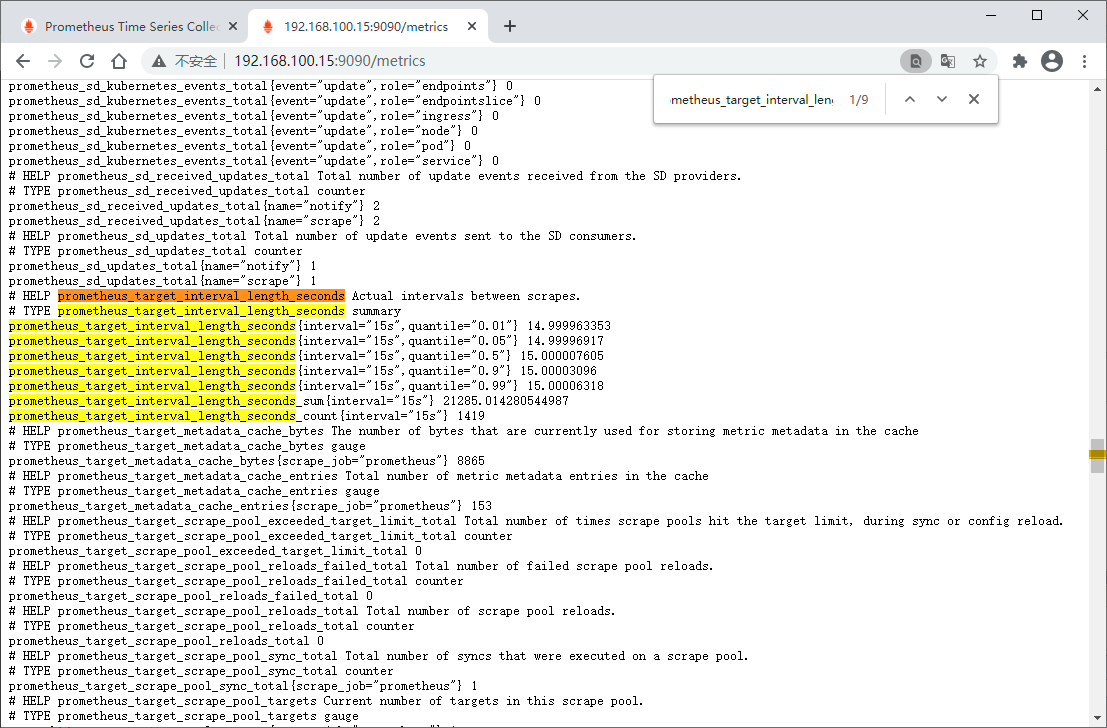
访问 localhost:9090/metrics 可以查看各项指标

举个例子
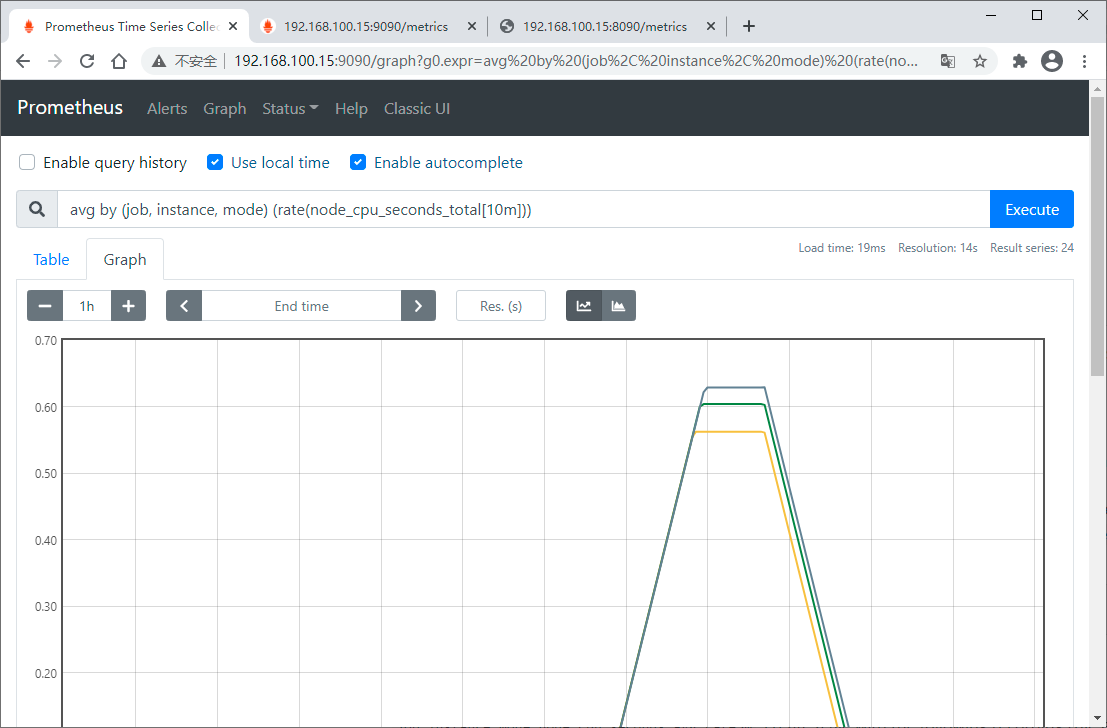
输入以下表达式,点“Execute”,可以看到以下效果
prometheus_target_interval_length_seconds
这应该返回多个不同的时间序列(以及每个序列的最新值),每个序列的指标名称均为prometheus_target_interval_length_seconds,但具有不同的标签。
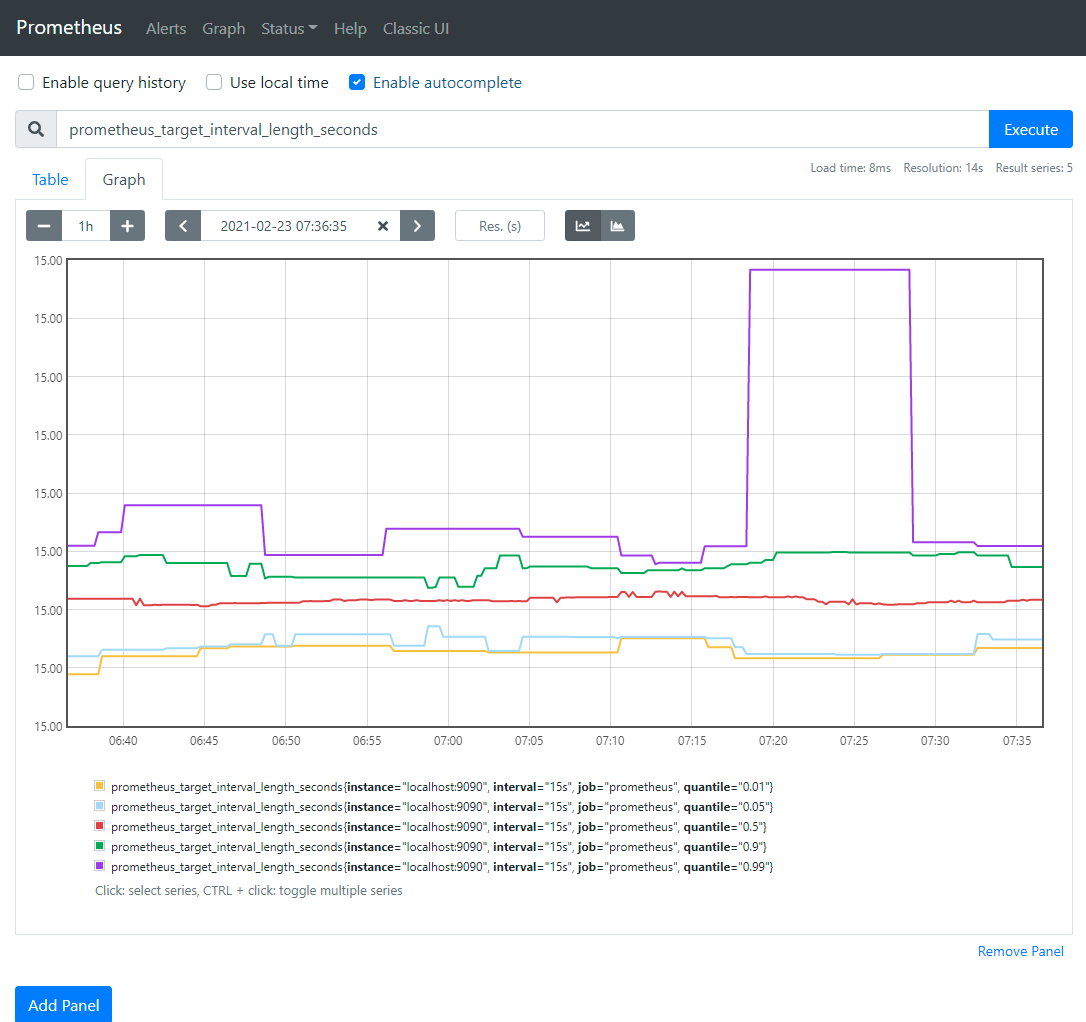
这个是以图形化的方式展示指标,通过localhost:9090/metrics查看也是一样的
如果我们只对99%的延迟感兴趣,我们可以使用以下查询:
prometheus_target_interval_length_seconds{quantile="0.99"}
为了计算返回的时间序列数,查询应该这样写:
count(prometheus_target_interval_length_seconds)
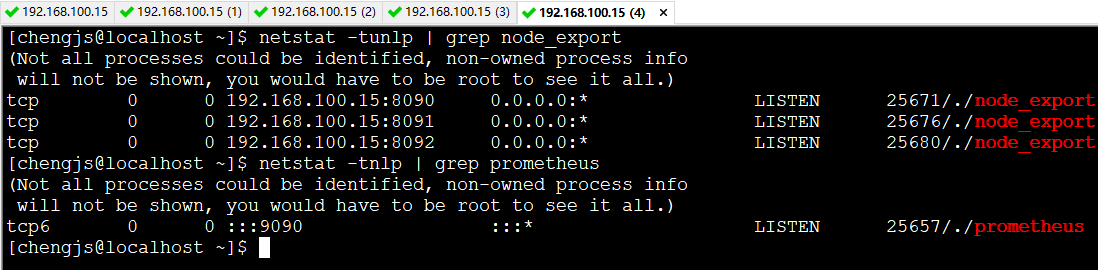
接下来,让我们利用Node Exporter来多添加几个目标:
tar -xzvf node_exporter-*.*.tar.gz
cd node_exporter-*.*

# Start 3 example targets in separate terminals:
./node_exporter --web.listen-address 127.0.0.1:8080
./node_exporter --web.listen-address 127.0.0.1:8081
./node_exporter --web.listen-address 127.0.0.1:8082
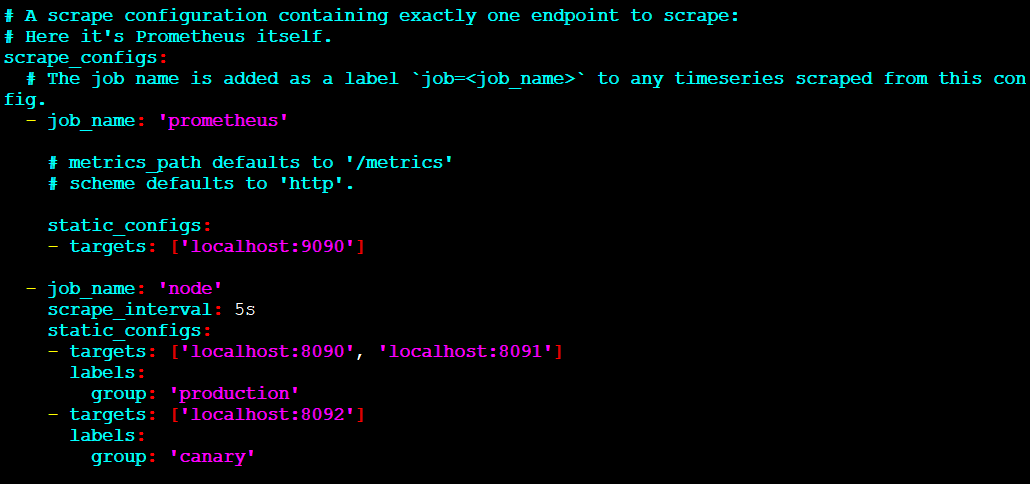
接下来,配置Prometheus来抓取这三个新目标
首先,定义一个名为'node'的作业,这个作业负责从这三个目标端点抓取数据。假设,想象前两个端点是生产环境的,另一个是非生产环境的,为了以示区别,我们将其打上两个不同的标签。在本示例中,我们将group="production"标签添加到第一个目标组,同时将group="canary"添加到第二个目标。
scrape_configs:
 - job_name:  'node'

 # Override the global default and scrape targets from this job every 5 seconds.
 scrape_interval: 5s

 static_configs:
  - targets: ['localhost:8080', 'localhost:8081']
  labels:
   group: 'production'

  - targets: ['localhost:8082']
  labels:
   group: 'canary'
3.1. 配置
为了查看所有的命令行参数,运行如下命令
./prometheus -h
配置文件是YAML格式的,可以使用 --config.file参数指定
配置文件的主要结构如下:
global:
 # How frequently to scrape targets by default.
 [ scrape_interval: <duration> | default = 1m ]

 # How long until a scrape request times out.
 [ scrape_timeout: <duration> | default = 10s ]

 # How frequently to evaluate rules.
 [ evaluation_interval: <duration> | default = 1m ]

 # The labels to add to any time series or alerts when communicating with
 # external systems (federation, remote storage, Alertmanager).
 external_labels:
 [ <labelname>: <labelvalue> ... ]

 # File to which PromQL queries are logged.
 # Reloading the configuration will reopen the file.
 [ query_log_file: <string> ]

# Rule files specifies a list of globs. Rules and alerts are read from
# all matching files.
rule_files:
 [ - <filepath_glob> ... ]

# A list of scrape configurations.
scrape_configs:
 [ - <scrape_config> ... ]

# Alerting specifies settings related to the Alertmanager.
alerting:
 alert_relabel_configs:
 [ - <relabel_config> ... ]
 alertmanagers:
 [ - <alertmanager_config> ... ]

# Settings related to the remote write feature.
remote_write:
 [ - <remote_write> ... ]

# Settings related to the remote read feature.
remote_read:
 [ - <remote_read> ... ]
4. 抓取 Spring Boot 应用
Prometheus希望抓取或轮询单个应用程序实例以获取指标。 Spring Boot在 /actuator/prometheus 提供了一个actuator端点,以适当的格式提供Prometheus抓取。
为了以Prometheus服务器可以抓取的格式公开指标,需要依赖 micrometer-registry-prometheus
<dependency>
 <groupId>io.micrometer</groupId>
 <artifactId>micrometer-registry-prometheus</artifactId>
 <version>1.6.4</version>
</dependency>
下面是一个示例 prometheus.yml
scrape_configs:
 - job_name: 'spring'
 metrics_path: '/actuator/prometheus'
 static_configs:
  - targets: ['HOST:PORT']
接下来,创建一个项目,名为prometheus-example
pom.xml
<?xml version="1.0" encoding="UTF-8"?>
<project xmlns="http://maven.apache.org/POM/4.0.0" xmlns:xsi="http://www.w3.org/2001/XMLSchema-instance"
   xsi:schemaLocation="http://maven.apache.org/POM/4.0.0 https://maven.apache.org/xsd/maven-4.0.0.xsd">
 <modelVersion>4.0.0</modelVersion>
 <parent>
  <groupId>org.springframework.boot</groupId>
  <artifactId>spring-boot-starter-parent</artifactId>
  <version>2.4.3</version>
  <relativePath/> <!-- lookup parent from repository -->
 </parent>
 <groupId>com.cjs.example</groupId>
 <artifactId>prometheus-example</artifactId>
 <version>0.0.1-SNAPSHOT</version>
 <name>prometheus-example</name>
 <description>Demo project for Spring Boot</description>
 <properties>
  <java.version>1.8</java.version>
 </properties>
 <dependencies>
  <dependency>
   <groupId>org.springframework.boot</groupId>
   <artifactId>spring-boot-starter-actuator</artifactId>
  </dependency>
  <dependency>
   <groupId>org.springframework.boot</groupId>
   <artifactId>spring-boot-starter-web</artifactId>
  </dependency>

  <dependency>
   <groupId>io.micrometer</groupId>
   <artifactId>micrometer-registry-prometheus</artifactId>
   <scope>runtime</scope>
  </dependency>
 </dependencies>

 <build>
  <plugins>
   <plugin>
    <groupId>org.springframework.boot</groupId>
    <artifactId>spring-boot-maven-plugin</artifactId>
   </plugin>
  </plugins>
 </build>

</project>
application.yml
spring:
 application:
 name: prometheus-example
management:
 endpoints:
 web:
  exposure:
  include: "*"
 metrics:
 tags:
  application: ${spring.application.name}
这句别忘了:management.metrics.tags.application=${spring.application.name}
Spring BootActuator 默认的端点很多,详见
https://docs.spring.io/spring-boot/docs/2.4.3/reference/html/production-ready-features.html
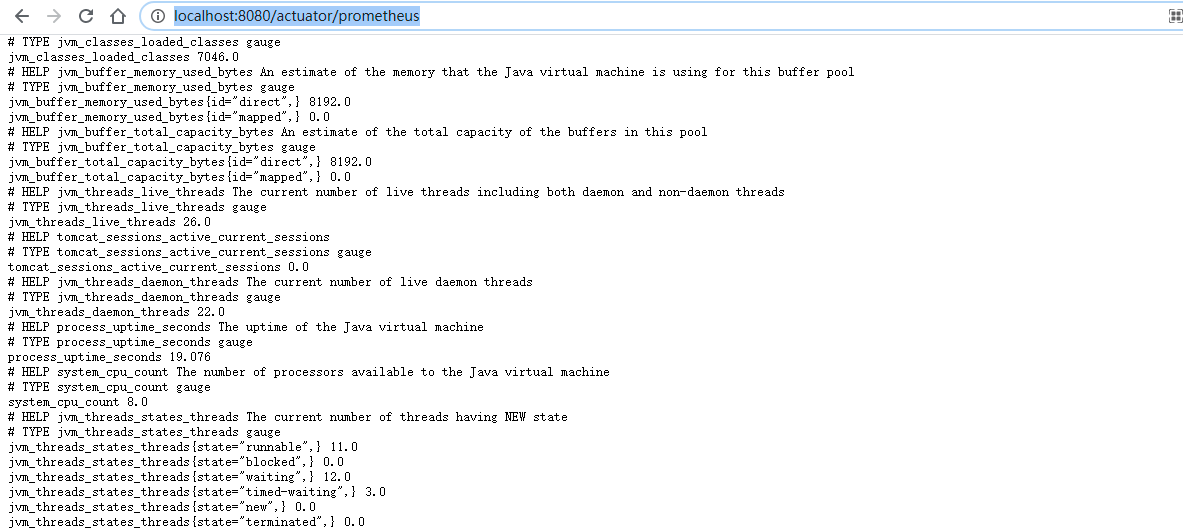
启动项目,浏览器访问/actuator/prometheus 端点
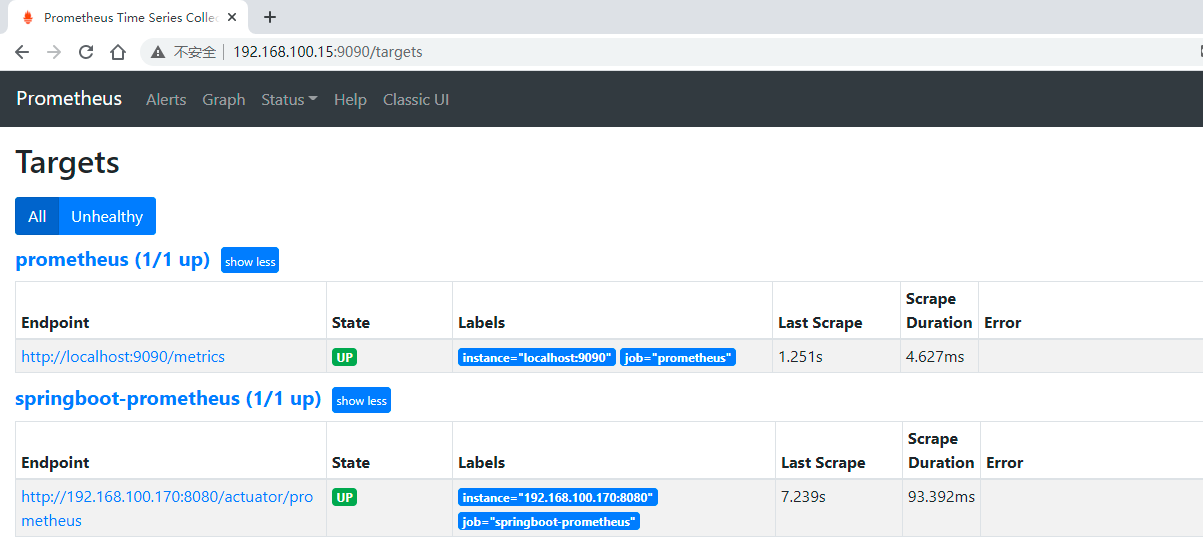
配置Prometheus抓取该应用
scrape_configs:
 # The job name is added as a label `job=<job_name>` to any timeseries scraped from this config.
 - job_name: 'prometheus'
 # metrics_path defaults to '/metrics'
 # scheme defaults to 'http'.
 static_configs:
 - targets: ['localhost:9090']

 - job_name: 'springboot-prometheus'
 metrics_path: '/actuator/prometheus'
 static_configs:
  - targets: ['192.168.100.93:8080']
重启服务
./prometheus --config.file=prometheus.yml
4.1. Grafana
https://grafana.com/tutorials/
下载&解压
wget https://dl.grafana.com/oss/release/grafana-7.4.3.linux-amd64.tar.gz
tar -zxvf grafana-7.4.3.linux-amd64.tar.gz
启动
./bin/grafana-server web
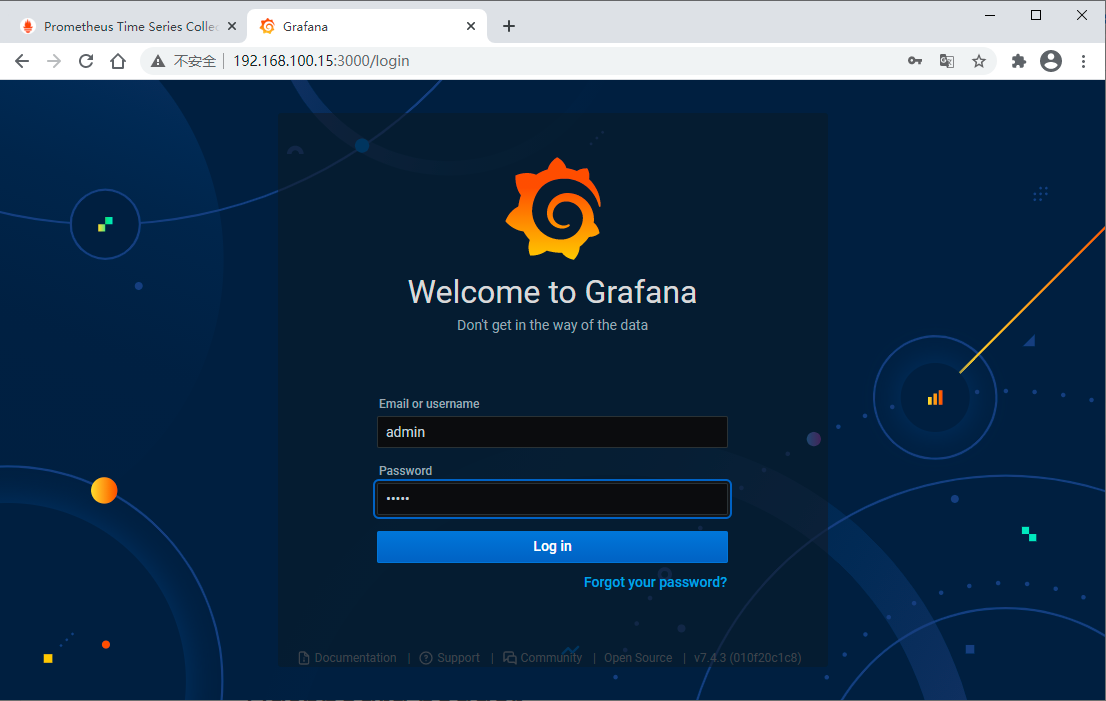
浏览器访问 http://localhost:3000
默认账号是 admin/admin
首次登陆后我们将密码改成admin1234
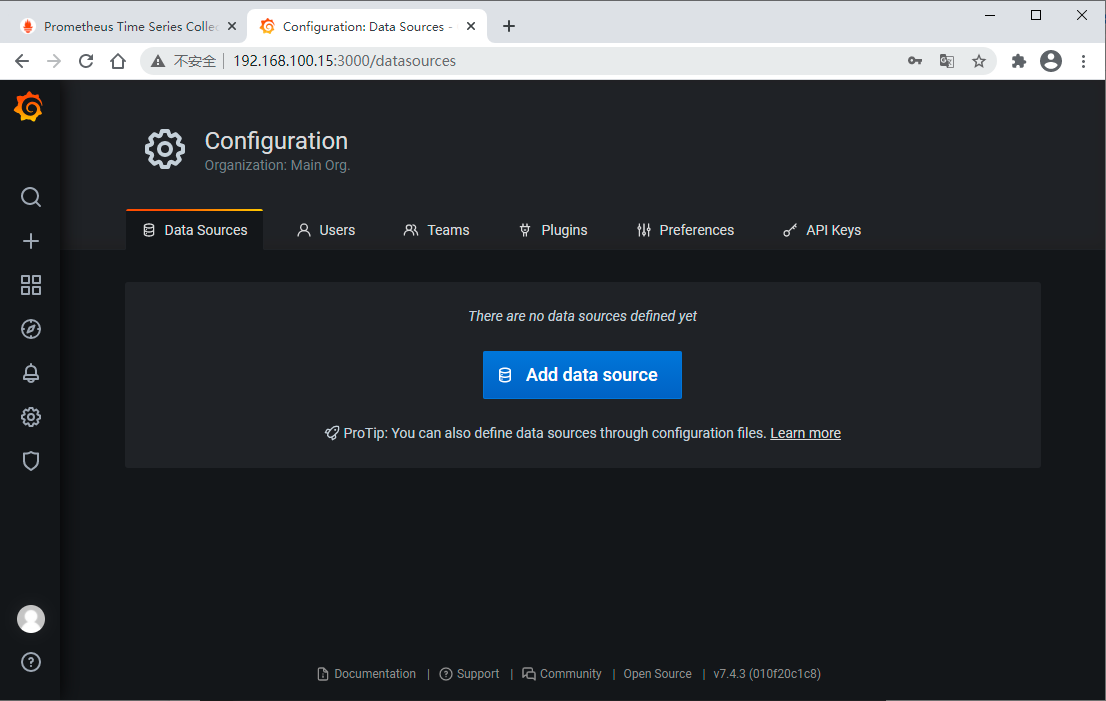
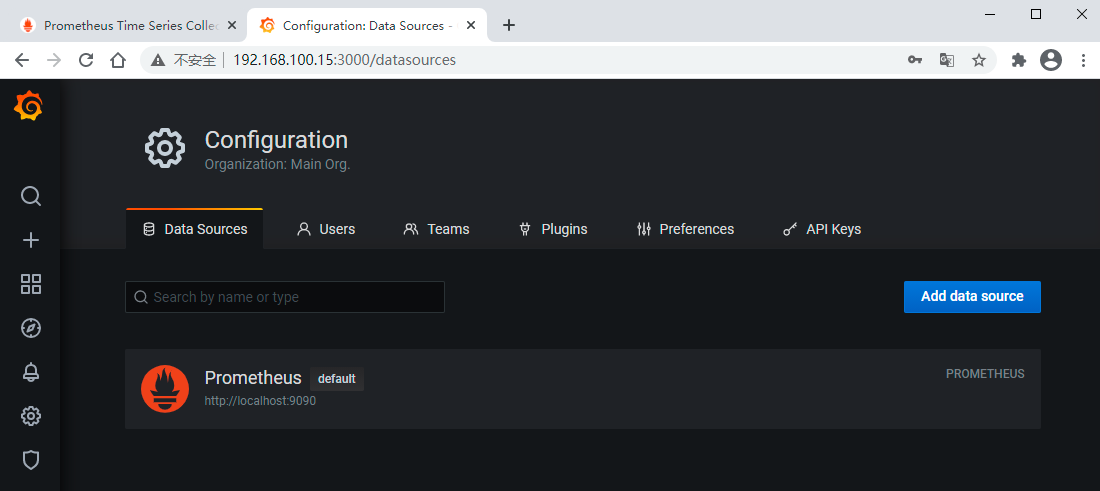
先配置一个数据源,一会儿添加仪表盘的时候要选择数据源的
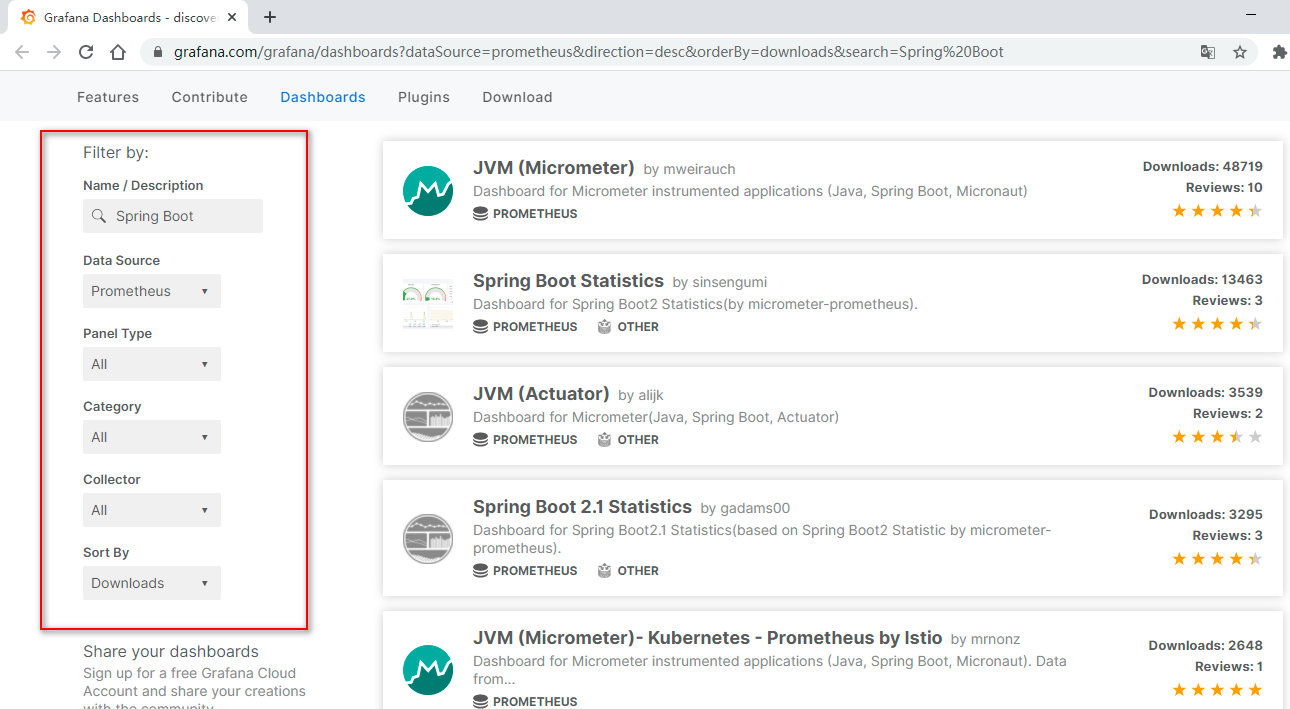
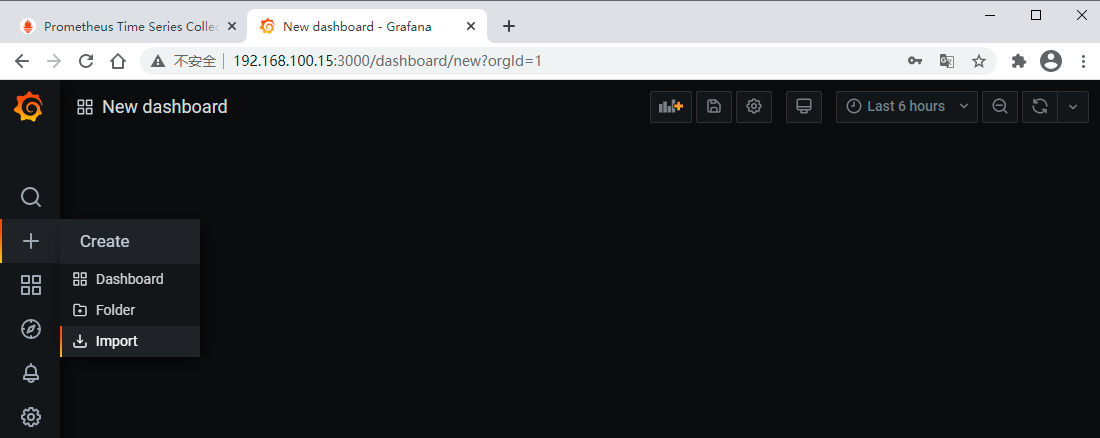
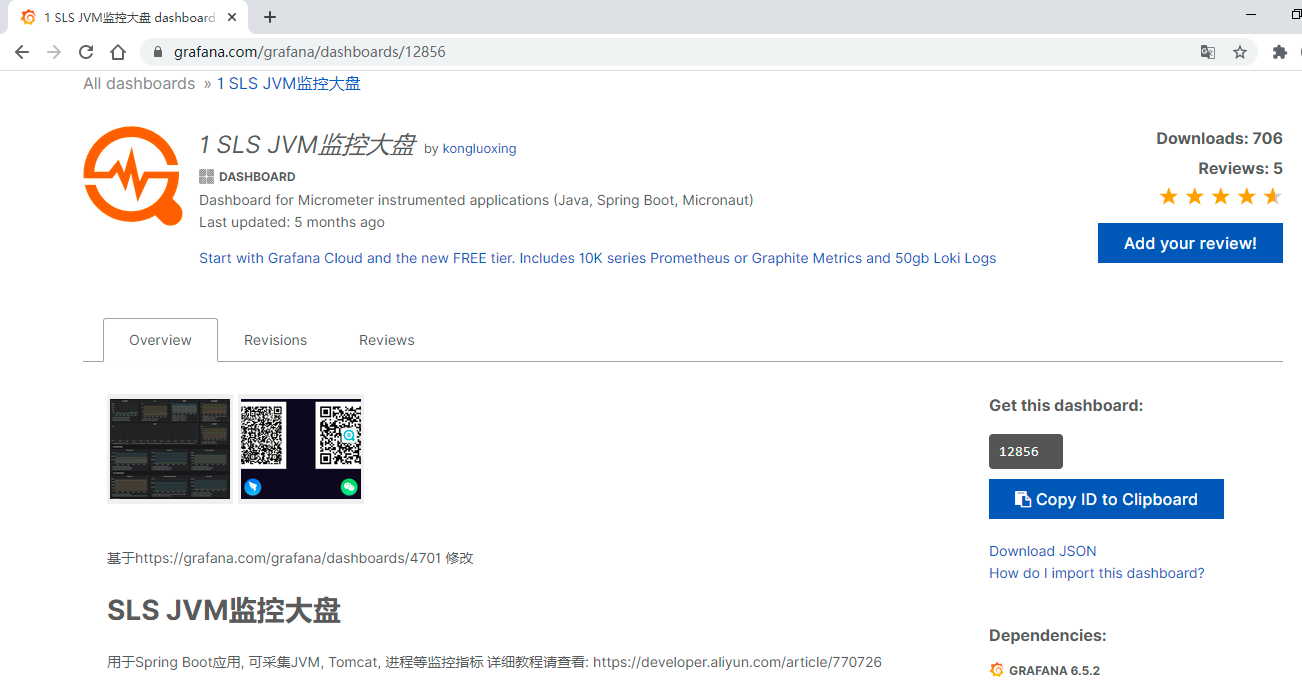
Grafana官方提供了很多模板,我们可以直接使用
首先要找到我们想要的模板

比如,我们这里随便选了一个模板
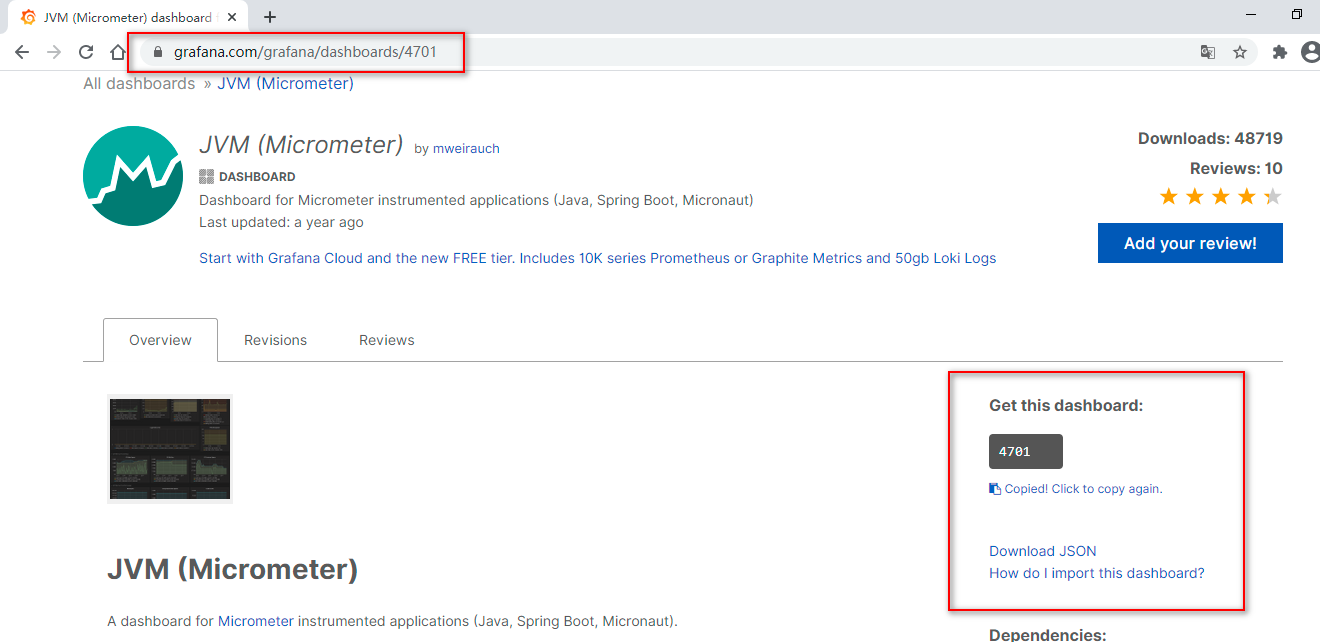
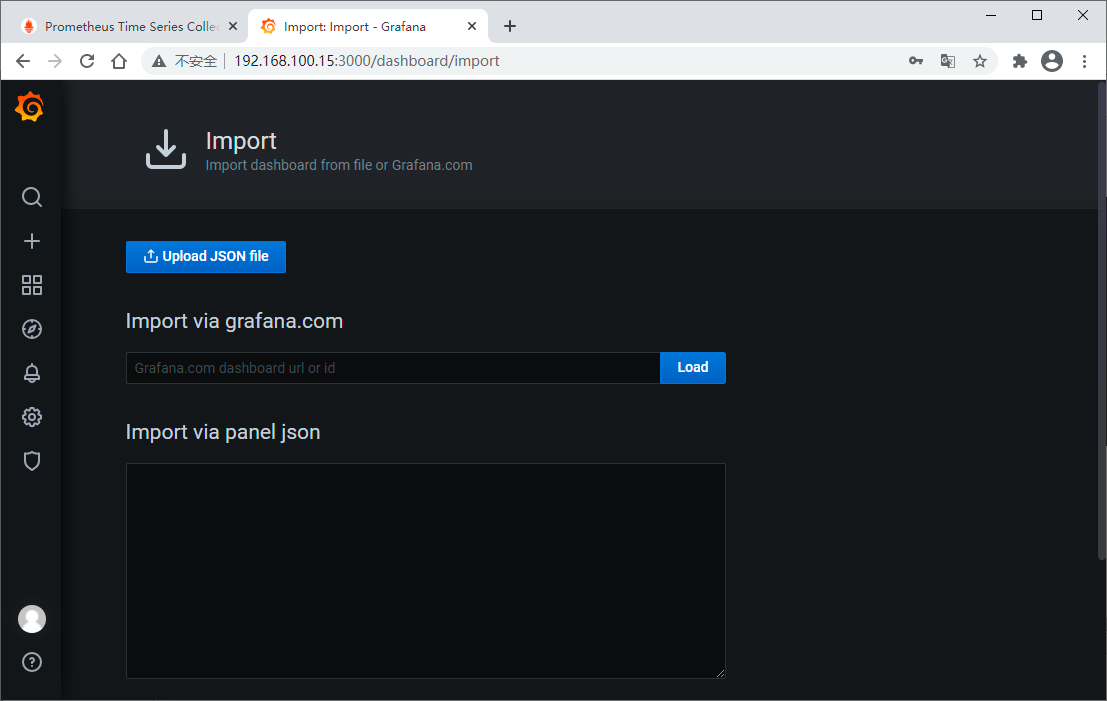
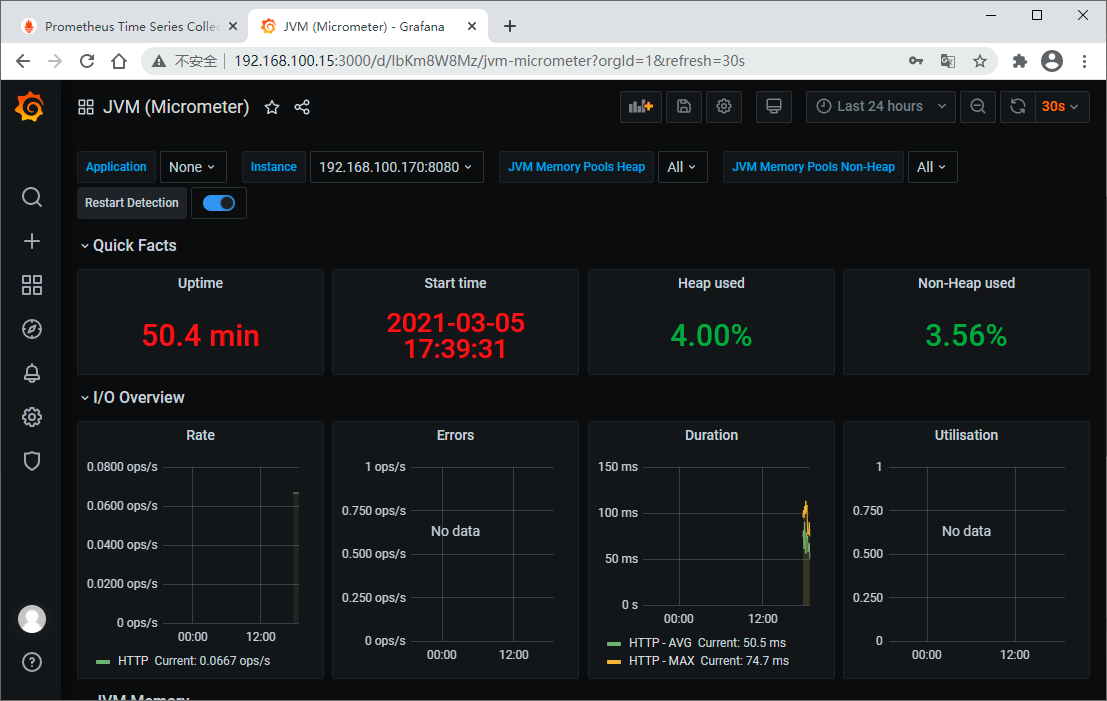
可以直接将模板JSON文件下载下来导入,也可以直接输入模板ID加载,这里我们直接输入模板ID
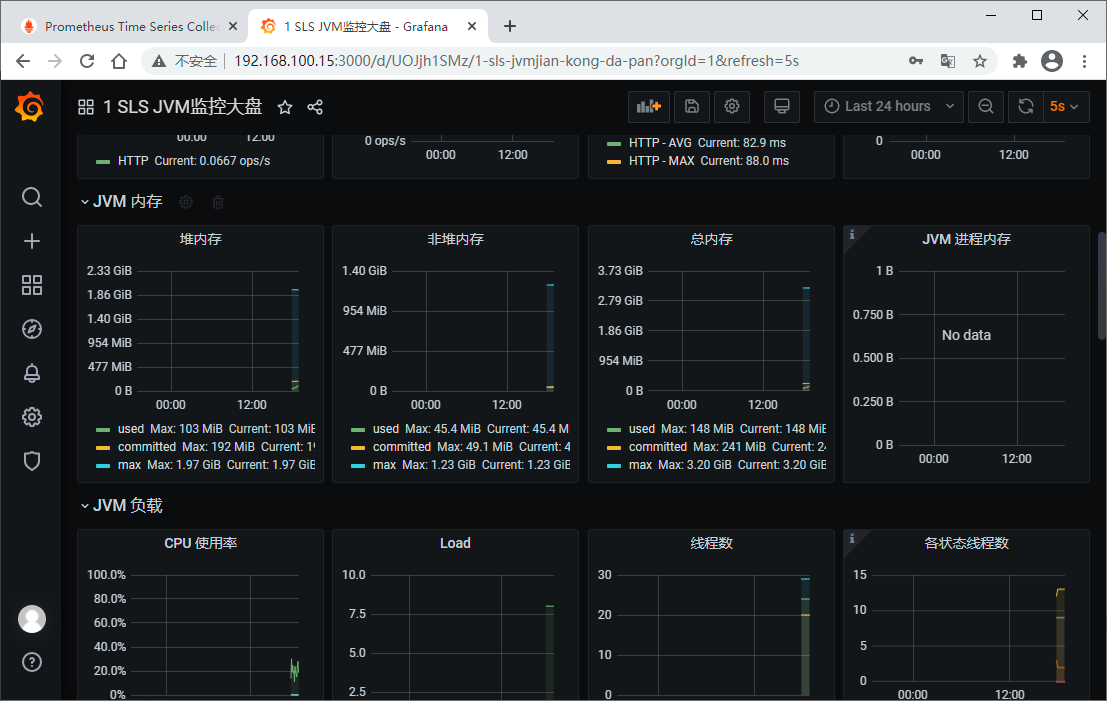
立竿见影,马上就看到漂亮的展示界面了
我们再添加一个DashBoard (ID:12856)
到此这篇关于Prometheus + Spring Boot 应用监控的文章就介绍到这了,更多相关Prometheus + Spring Boot 应用监控内容请搜索自学编程网以前的文章或继续浏览下面的相关文章希望大家以后多多支持自学编程网!

- 本文固定链接: https://zxbcw.cn/post/207003/
- 转载请注明:必须在正文中标注并保留原文链接
- QQ群: PHP高手阵营官方总群(344148542)
- QQ群: Yii2.0开发(304864863)