
prometheus通过exporter监控mysql,并用grafana图表展示
概述:
prometheus是由SoundCloud开发的开源监控告警系统并且自带时序数据库,基于Go语言。Prometheus根据配置的任务(job)以周期性pull的方式获取指定目标(target)上的指标(metric)。
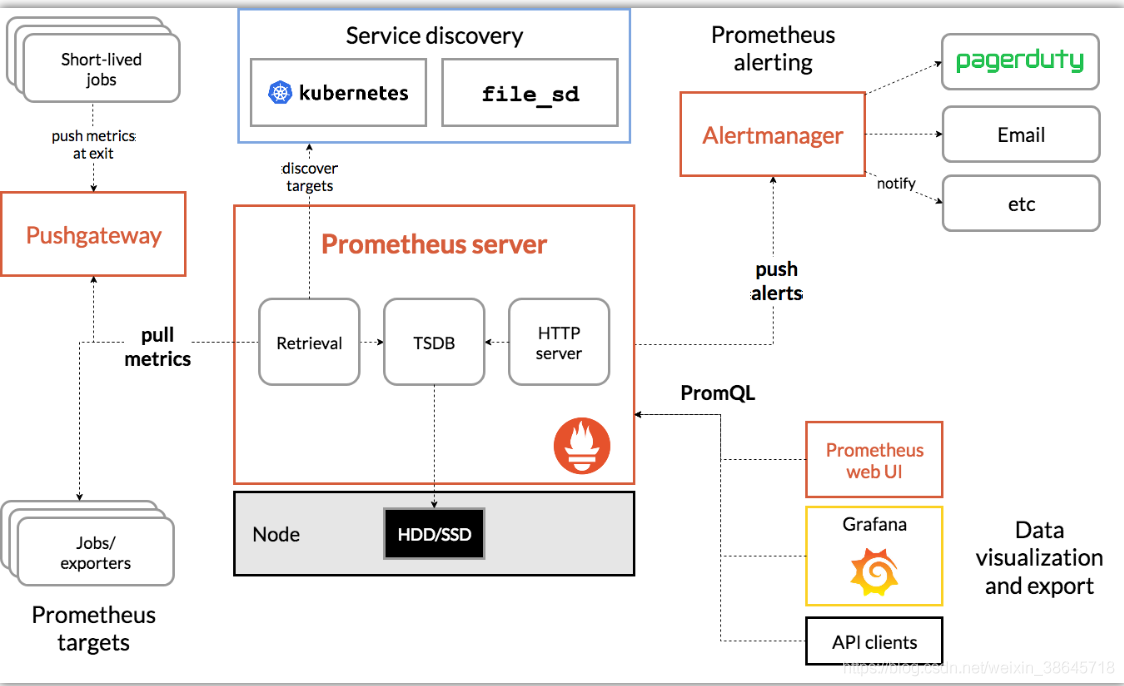
Prometheus 生态圈中包含了多个组件:
- Prometheus Server: 根据配置完成数据采集, 服务发现以及数据存储。
- Push Gateway : 为应对部分push场景提供的插件,监控数据先推送到 Push Gateway 上,然后再由 Prometheus Server 端采集 pull 。用于存在时间较短,可能在 Prometheus 来 pull 之前就消失了的 jobs (若 Prometheus Server 采集间隔期间,Push Gateway 上的数据没有变化, Prometheus Server 将采集到2次相同的数据,仅时间戳不同)
- Exporters(探针): 是Prometheus的一类数据采集组件的总称。它负责从目标处搜集数据,并将其转化为Prometheus支持的格式。与传统的数据采集组件不同的是,它并不向中央服务器发送数据,而是等待中央服务器主动前来抓取。
- Alertmanager: Prometheus server 主要负责根据基于PromQL的告警规则分析数据,如果满足PromQL定义的规则,则会产生一条告警,并发送告警信息到Alertmanager,Alertmanager则是根据配置处理告警信息并发送。常见的接收方式有:电子邮件,webhook 等。Alertmanager三种处理告警信息的方式:分组,抑制,静默。
接下来开始演示
1、测试机器
prometheus-server 192.168.56.140
MySQL host01 192.168.56.103
MySQL host02 192.168.56.104
2、配置mysql host01
MySQL使用版本:
8.0.25 MySQL Community Server
3、创建exporter帐号
mysqld_exporter通过查询mysql的状态表及状态命令获取数据。所以,需要先在mysql内,创建相应帐号
create user 'exporter'@'%' identified by 'Xiaopang*803';
GRANT REPLICATION CLIENT, PROCESS ON *.* TO 'exporter'@'%';
GRANT SELECT ON performance_schema.* TO 'exporter'@'%';
flush privileges;
4、下载,安装mysqld_exporter
wget https://github.com/prometheus/mysqld_exporter/releases/download/v0.13.0/mysqld_exporter-0.13.0.linux-amd64.tar.gz
tar xvzf mysqld_exporter-0.13.0.linux-amd64.tar.gz -C /usr/local/.
cd /usr/local && ln -s mysqld_exporter-0.13.0.linux-amd64/ mysqld_exporter
4.1 编辑文件输入密码
编缉如下文件,输入exporter用户句与密码(与前面mysql内创建的帐号密码一致)
[root@host01 mysqld_exporter]# vi .my.cnf
[client]
user=exporter
password=Xiaopang*803
4.2 添加启动服务文件
[root@host01 ~]# vi /etc/systemd/system/mysqld_exporter.service
[Unit]
Description=mysqld_exporter
After=network.target

[Service]
Type=simple
ExecStart=/usr/local/mysqld_exporter/mysqld_exporter --config.my-cnf=/usr/local/mysqld_exporter/.my.cnf
Restart=on-failure

[Install]
WantedBy=multi-user.target
4.3 启动mysqld_exporter
service mysqld_exporter start
4.4 测试验证
mysqld_exporter默认使用9104端口,我们可以在浏览器内输入如下地址。查看是否有数据输出。
输入 http://192.168.56.103:9104/metrics
输出信息类似如下:
# HELP go_gc_duration_seconds A summary of the pause duration of garbage collection cycles.
# TYPE go_gc_duration_seconds summary
go_gc_duration_seconds{quantile="0"} 2.5395e-05
go_gc_duration_seconds{quantile="0.25"} 3.5372e-05
go_gc_duration_seconds{quantile="0.5"} 3.9393e-05
go_gc_duration_seconds{quantile="0.75"} 5.5068e-05
go_gc_duration_seconds{quantile="1"} 0.062537624
go_gc_duration_seconds_sum 0.453204071
go_gc_duration_seconds_count 2131
# HELP go_goroutines Number of goroutines that currently exist.
# TYPE go_goroutines gauge
5、下载,安装node_exporter
如果只安装mysqld_exporter则无法监控OS相关的数据,所以需要安装node_exporter进行OS监控。
wget https://github.com/prometheus/node_exporter/releases/download/v1.2.2/node_exporter-1.2.2.linux-amd64.tar.gz

tar xvzf node_exporter-1.2.2.linux-amd64.tar.gz -C /usr/local/.
cd /usr/local && ln -s node_exporter-1.2.2.linux-amd64/ node_exporter
5.1 添加启动服务文件
[root@host01 ~]# vi /etc/systemd/system/node_exporter.service
[Unit]
Description=node_export
Documentation=https://github.com/prometheus/node_exporter
After=network.target

[Service]
Type=simple
User=root
Group=root
ExecStart=/usr/local/node_exporter/node_exporter
Restart=on-failure
[Install]
WantedBy=multi-user.target
5.2 启动node_exporter
service node_exporter start
5.3 测试验证
node_exporter默认使用9100端口,我们可以在浏览器内输入如下地址。查看是否有数据输出。
输入 http://192.168.56.103:9100/metrics
输出结果类似如下:
# HELP go_gc_duration_seconds A summary of the pause duration of garbage collection cycles.
# TYPE go_gc_duration_seconds summary
go_gc_duration_seconds{quantile="0"} 2.5934e-05
go_gc_duration_seconds{quantile="0.25"} 4.0072e-05
go_gc_duration_seconds{quantile="0.5"} 4.7616e-05
go_gc_duration_seconds{quantile="0.75"} 6.726e-05
go_gc_duration_seconds{quantile="1"} 0.228887598
go_gc_duration_seconds_sum 0.550266258
go_gc_duration_seconds_count 793
# HELP go_goroutines Number of goroutines that currently exist.
# TYPE go_goroutines gauge
6、安装prometheus+grafana
使用版本:
prometheus 2.28
grafana 6.7.6
6.1 安装
下载软件包
wget https://github.com/prometheus/prometheus/releases/download/v2.28.1/prometheus-2.28.1.linux-amd64.tar.gz
6.2 解压并添加软链接
tar xvzf prometheus-2.28.1.linux-amd64.tar.gz -C /usr/local/.
cd /usr/local/
ln -s prometheus-2.28.1.linux-amd64/ prometheus
6.3 增加启动服务
[root@prometheus-server prometheus]# vi /etc/systemd/system/prometheus.service
[Unit]
Description=Prometheus Monitoring System
Documentation=Prometheus Monitoring System

[Service]
Type=simple
User=root
Group=root
ExecStart=/usr/local/prometheus/prometheus \
--config.file=/usr/local/prometheus/prometheus.yml \
--storage.tsdb.path="data/" \
--storage.tsdb.retention.time=15d \
--web.max-connections=512 \
--web.listen-address=:9090
6.4 添加mysql监控
vi /usr/local/prometheus/prometheus.yml
scrape_configs:
# The job name is added as a label `job=<job_name>` to any timeseries scraped from this config.

  - job_name: 'mysql'
    static_configs:
      - targets: ['192.168.56.103:9104']
        labels:
          instance: mysql_instance1
  - job_name: 'linux'
    static_configs:
      - targets: ['192.168.56.103:9100']
        labels:
          instance: mysql_instance1
6.5 启动prometheus
service prometheus start
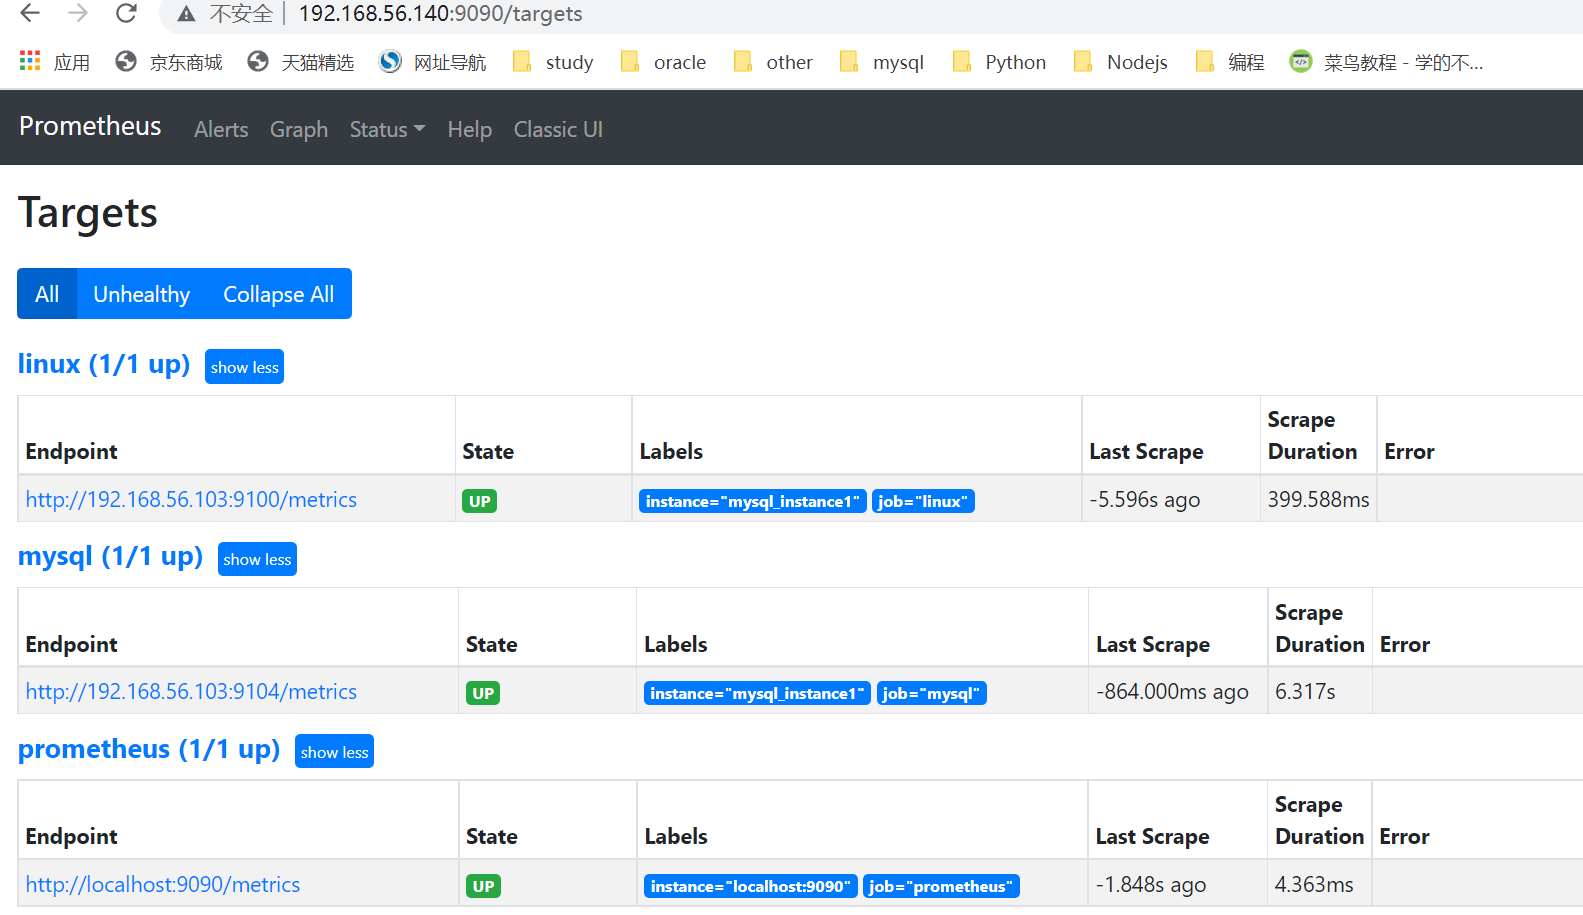
6.7 查看prometheus
prometheus默认监控端口
http://192.168.56.140:9090/
点击status->target。如果一切正常,可以看到如下mysql/linux的state为UP
7、下载,安装grafana
wget https://dl.grafana.com/oss/release/grafana-6.7.6-1.x86_64.rpm
rpm -ivh grafana-6.7.6-1.x86_64.rpm
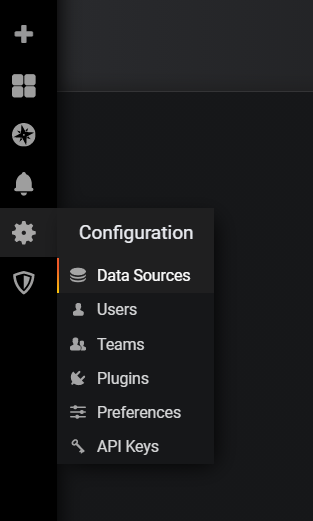
7.1 访问grafana
prometheus的展示功能很弱,为了更好的进行图形展示,所以我们需要grafana
输入 http://192.168.56.140:3000/
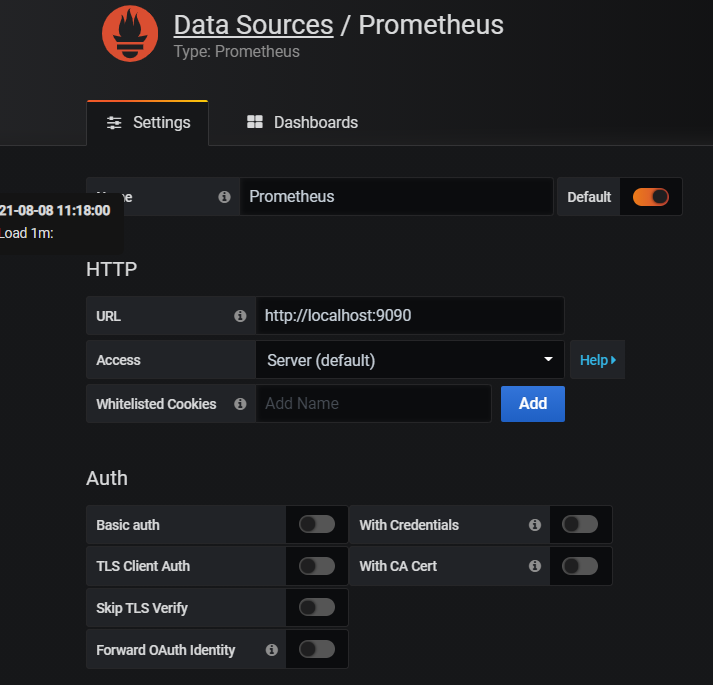
配置data source为proemtheus的HTTP链接(注意是HTTP,而不是HTTPS)
7.2导入mysql监控模板
grafana数据的展示是通过模板实现的。grafana网站上面有很多共享的模板,你可以自行探索。
本例模板,我是从如下链接下载的。
https://grafana.com/api/dashboards/9623/revisions/4/download
版本不匹配问题
因为版本不太匹配的原因,完成后有些项目如法正常显示。它使用的版本是grafana5.0版本,我的是6.x版本。
但是这点小问题,难不倒我,我自己修改了一下。就能正常显示了,如下是修改后的JSON文件。
修改过程
很多时候,很多东西并不完全能拿来即用。我们需要根据自己的需要进行一些修改。
接下来大概花了半个多小时,弄清楚了如何修改了。而后大概又花了两小时,修改完成的相应的项目。
修改过程中,碰到的问题,主要就两类:
1)grafana 5.x和6.x组件的名称发生了变化。
"Buffer Pool Size of Total RAM"无法正常显示,原因是6.0和5.0组件名不同。
替换 pmm-singlestat-panel -> singlestat搞定
2)exporter提取的属性名字发生了变化
我用的是node_exporter-1.2.2,这里面关于OS提取的属性与JSON文件的定义属性名不匹配。
方法是直接在“http://192.168.56.103:9100/metrics”里面搜索新的属性名,替换JSON文件里面的旧的属性名。
例如:
替换 node_memory_MemTotal->node_memory_MemTotal_bytes
替换 node_memory_MemTotal->node_memory_MemTotal_bytes
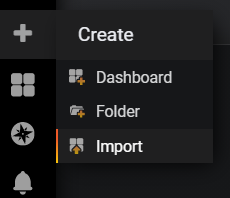
进行导入
因为我进行了一些修改,你可以import的时候,直接把JSON的内容输入进去。
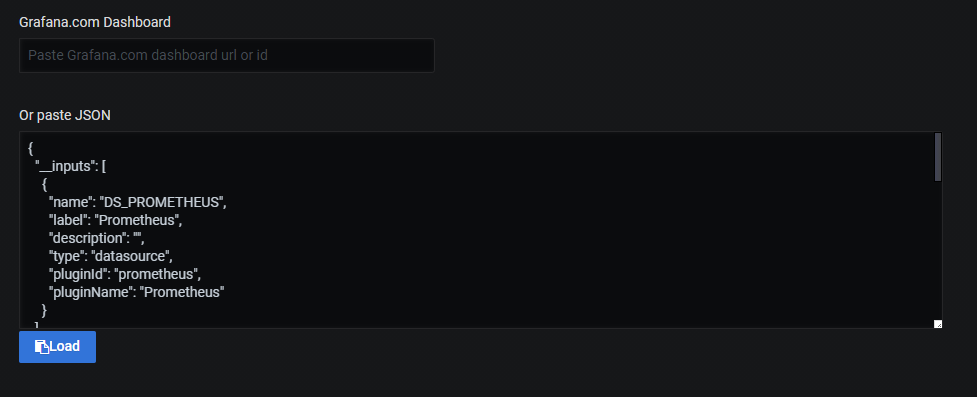
点击Load加载,接下来,选择数据源为prometheus。

7.3 启动sysbench压测工具
开启sysbench工具的目的是通过压测生成有数据变化的图表(不然,没有流量,数据也不会动)。
这里,我从远端压测(在另一台机器host02上运行sysbench)。目的是为了生成网络流量数据。
[root@host02 ~]# sysbench /usr/share/sysbench/oltp_read_write.lua --time=9180 --mysql-host=host01 --mysql-port=3306 --mysql-user=dbusr --mysql-password=Xiaopang*803 --mysql-db=db1 --table-size=50000 --tables=15 --threads=15 --report-interval=10 run
sysbench 1.0.20 (using bundled LuaJIT 2.1.0-beta2)

Running the test with following options:
Number of threads: 15
Report intermediate results every 10 second(s)
Initializing random number generator from current time


Initializing worker threads...

Threads started!

[ 10s ] thds: 15 tps: 112.68 qps: 2268.92 (r/w/o: 1589.76/452.30/226.85) lat (ms,95%): 277.21 err/s: 0.00 reconn/s: 0.00
[ 20s ] thds: 15 tps: 113.91 qps: 2282.81 (r/w/o: 1598.47/456.52/227.81) lat (ms,95%): 211.60 err/s: 0.00 reconn/s: 0.00
[ 30s ] thds: 15 tps: 109.80 qps: 2192.95 (r/w/o: 1536.66/436.69/219.59) lat (ms,95%): 240.02 err/s: 0.00 reconn/s: 0.00
[ 40s ] thds: 15 tps: 112.70 qps: 2265.36 (r/w/o: 1583.17/456.79/225.40) lat (ms,95%): 193.38 err/s: 0.00 reconn/s: 0.00
[ 50s ] thds: 15 tps: 101.00 qps: 2013.42 (r/w/o: 1413.32/398.10/202.00) lat (ms,95%): 325.98 err/s: 0.00 reconn/s: 0.00
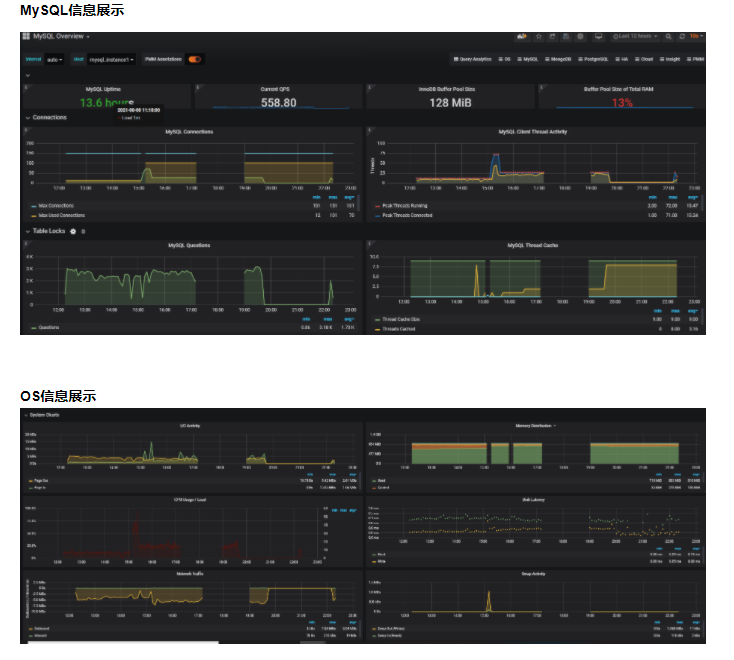
7.4查看grafana,完成后效果
这里只贴出了部分图表。
到此这篇关于Prometheus MySQL监控使用grafana展示的文章就介绍到这了,更多相关 MySQL grafana内容请搜索自学编程网以前的文章或继续浏览下面的相关文章希望大家以后多多支持自学编程网!

- 本文固定链接: https://zxbcw.cn/post/221023/
- 转载请注明:必须在正文中标注并保留原文链接
- QQ群: PHP高手阵营官方总群(344148542)
- QQ群: Yii2.0开发(304864863)