
2020
10-08
10-08
Matplotlib.pyplot 三维绘图的实现示例
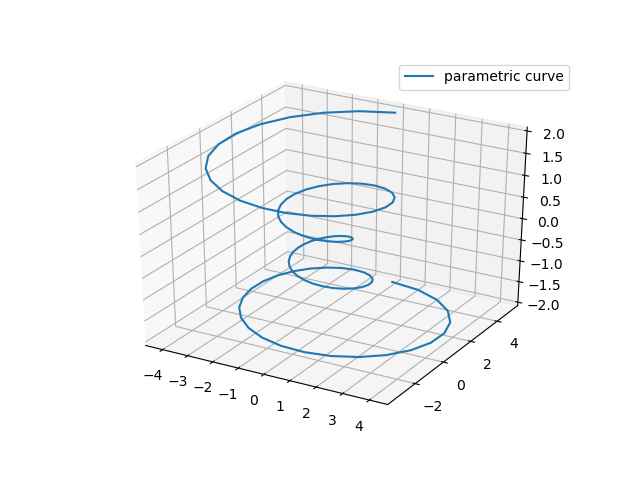 折线图Axes3D.plot(xs,ys,*args,**kwargs)ArgumentDescriptionxs, ysx,ycoordinatesofverticeszszvalue(s),eitheroneforallpointsoroneforeachpoint.zdirWhichdirectiontouseasz(‘x',‘y'or‘z')whenplottinga2Dset.importmatplotlibasmplfrommpl_toolkits.mplot3dimportAxes3Dimportnumpy...
继续阅读 >
折线图Axes3D.plot(xs,ys,*args,**kwargs)ArgumentDescriptionxs, ysx,ycoordinatesofverticeszszvalue(s),eitheroneforallpointsoroneforeachpoint.zdirWhichdirectiontouseasz(‘x',‘y'or‘z')whenplottinga2Dset.importmatplotlibasmplfrommpl_toolkits.mplot3dimportAxes3Dimportnumpy...
继续阅读 >