计算概率分布的相关参数时,一般使用 scipy 包,常用的函数包括以下几个:
pdf:连续随机分布的概率密度函数
pmf:离散随机分布的概率密度函数
cdf:累计分布函数
百分位函数(累计分布函数的逆函数)
生存函数的逆函数(1 - cdf 的逆函数)
函数里面不仅能跟一个数据,还能跟一个数组。下面用正态分布举例说明:
>>> import scipy.stats as st

>>> st.norm.cdf(0) # 标准正态分布在 0 处的累计分布概率值
0.5

>>> st.norm.cdf([-1, 0, 1])# 标准正态分布分别在 -1, 0, 1 处的累计分布概率值
array([0.15865525, 0.5, 0.84134475])

>>> st.norm.pdf(0) # 标准正态分布在 0 处的概率密度值
0.3989422804014327

>>> st.norm.ppf(0.975)# 标准正态分布在 0.975 处的逆函数值
1.959963984540054

>>> st.norm.lsf(0.975)# 标准正态分布在 0.025 处的生存函数的逆函数值
1.959963984540054
对于非标准正态分布,通过更改参数 loc 与 scale 来改变均值与标准差:
>>> st.norm.cdf(0, loc=2, scale=1) # 均值为 2,标准差为 1 的正态分布在 0 处的累计分布概率值
0.022750131948179195
对于其他随机分布,可能更改的参数不一样,具体需要查官方文档。下面我们举一些常用分布的例子:
>>> st.binom.pmf(4, n=100, p=0.05) # 参数值 n=100, p=0.05 的二项分布在 4 处的概率密度值
0.17814264156968956

>>> st.geom.pmf(4, p=0.05) # 参数值 p=0.05 的几何分布在 4 处的概率密度值
0.04286875

>>> st.poisson.pmf(2, mu=3) # 参数值 mu=3 的泊松分布在 2 处的概率密度值
0.22404180765538775

>>> st.chi2.ppf(0.95, df=10) # 自由度为 10 的卡方分布在 0.95 处的逆函数值
18.307038053275146

>>> st.t.ppf(0.975, df=10) # 自由度为 10 的 t 分布在 0.975 处的逆函数值
2.2281388519649385

>>> st.f.ppf(0.95, dfn=2, dfd=12) # 自由度为 2, 12 的 F 分布在 0.95 处的逆函数值
3.8852938346523933
补充拓展:给定概率密度,生成随机数 python实现
实现的方法可以不止一种:
rejection sampling
invert the cdf
Metropolis Algorithm (MCMC)
本篇介绍根据累积概率分布函数的逆函数(2:invert the CDF)生成的方法。
自己的理解不一定正确,有错误望指正。
目标:
已知 y=pdf(x),现想由给定的pdf, 生成对应分布的x
PDF是概率分布函数,对其积分或者求和可以得到CDF(累积概率分布函数),PDF积分或求和的结果始终为1
步骤(具体解释后面会说):
1、根据pdf得到cdf
2、由cdf得到inverse of the cdf
3、对于给定的均匀分布[0,1),带入inverse cdf,得到的结果即是我们需要的x
求cdf逆函数的具体方法:
对于上面的第二步,可以分成两类:
1、当CDF的逆函数好求时,直接根据公式求取,
2、反之当CDF的逆函数不好求时,用数值模拟方法
自己的理解:为什么需要根据cdf的逆去获得x?
原因一:
因为cdf是单调函数因此一定存在逆函数(cdf是s型函数,而pdf则不一定,例如正态分布,不单调,对于给定的y,可能存在两个对应的x,就不可逆)
原因二:
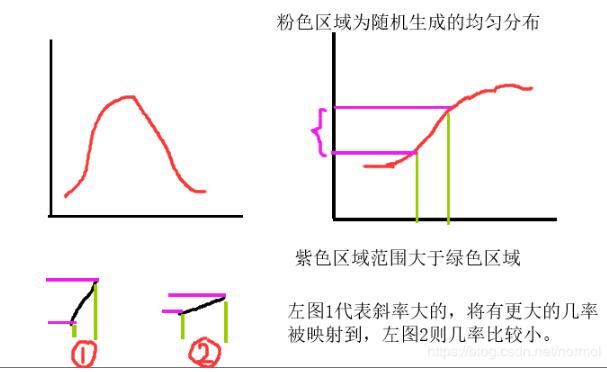
这仅是我自己的直观理解,根据下图所示(左上为pdf,右上为cdf)

由步骤3可知,我们首先生成[0,1)的均匀随机数,此随机数作为cdf的y,去映射到cdf的x(若用cdf的逆函数表示则是由x映射到y),可以参考上图的右上,既然cdf的y是均匀随机的,那么对于cdf中同样范围的x,斜率大的部分将会有更大的机会被映射,因为对应的y范围更大(而y是随即均匀分布的),那么,cdf的斜率也就等同于pdf的值,这正好符合若x的pdf较大,那么有更大的概率出现(即重复很多次后,该x会出现的次数最多)
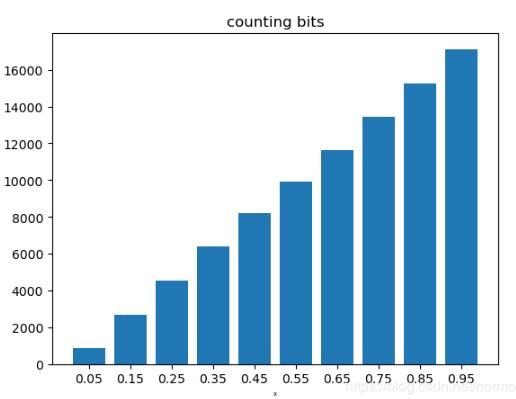
代码实现——方法一,公式法
import numpy as np
import math
import random
import matplotlib.pyplot as plt
import collections

count_dict = dict()
bin_count = 20

def inverseCDF():
 """
 return the x value in PDF
 """
 uniform_random = random.random()
 return inverse_cdf(uniform_random)


def pdf(x):
 return 2 * x

# cdf = x^2, 其逆函数很好求,因此直接用公式法
def inverse_cdf(x):
 return math.sqrt(x)


def draw_pdf(D):
	global bin_count
 D = collections.OrderedDict(sorted(D.items()))
 plt.bar(range(len(D)), list(D.values()), align='center')
 # 因为映射bin的时候采用的floor操作,因此加上0.5
 value_list = [(key + 0.5) / bin_count for key in D.keys()]
 plt.xticks(range(len(D)), value_list)
 plt.xlabel('x', fontsize=5)
 plt.ylabel('counts', fontsize=5)
 plt.title('counting bits')
 plt.show()

for i in range(90000):
 x = inverseCDF()
 # 用bin去映射,否则不好操作
 bin = math.floor(x * bin_count) # type(bin): int
 count_dict[bin] = count_dict.get(bin, 0) + 1

draw_pdf(count_dict)
结果:

代码实现——方法二,数值法
数值模拟cdf的关键是创建lookup table,
table的size越大则结果越真实(即区间划分的个数)
import numpy as np
import math
import random
import matplotlib.pyplot as plt
import collections

lookup_table_size = 40
CDFlookup_table = np.zeros((lookup_table_size))

count_dict = dict()
bin_count = 20

def inverse_cdf_numerically(y):
 global lookup_table_size
 global CDFlookup_table
 value = 0.0
 for i in range(lookup_table_size):
  x = i * 1.0 / (lookup_table_size - 1)
  value += pdf2(x)
  CDFlookup_table[i] = value
 CDFlookup_table /= value # normalize the cdf

 if y < CDFlookup_table[0]:
  t = y / CDFlookup_table[0]
  return t / lookup_table_size
 index = -1
 for j in range(lookup_table_size):
  if CDFlookup_table[j] >= y:
   index = j
   break
 # linear interpolation
 t = (y - CDFlookup_table[index - 1]) / \
  (CDFlookup_table[index] - CDFlookup_table[index - 1])
 fractional_index = index + t # 因为index从0开始,所以不是 (index-1)+t
 return fractional_index / lookup_table_size


def inverseCDF():
 """
 return the x value in PDF
 """
 uniform_random = random.random()
 return inverse_cdf_numerically(uniform_random)


def pdf2(x):
 return (x * x * x - 10.0 * x * x + 5.0 * x + 11.0) / (10.417)

def draw_pdf(D):
 global bin_count
 D = collections.OrderedDict(sorted(D.items()))
 plt.bar(range(len(D)), list(D.values()), align='center')
 value_list = [(key + 0.5) / bin_count for key in D.keys()]
 plt.xticks(range(len(D)), value_list)
 plt.xlabel('x', fontsize=5)
 plt.ylabel('counts', fontsize=5)
 plt.title('counting bits')
 plt.show()


for i in range(90000):
 x = inverseCDF()
 bin = math.floor(x * bin_count) # type(bin): int
 count_dict[bin] = count_dict.get(bin, 0) + 1

draw_pdf(count_dict)
真实函数与模拟结果

扩展:生成伯努利、正太分布
import numpy as np
import matplotlib.pyplot as plt
"""
reference:
https://blog.demofox.org/2017/07/25/counting-bits-the-normal-distribution/
"""


def plot_bar_x():
 # this is for plotting purpose
 index = np.arange(counting.shape[0])
 plt.bar(index, counting)
 plt.xlabel('x', fontsize=5)
 plt.ylabel('counts', fontsize=5)
 plt.title('counting bits')
 plt.show()


# if dice_side=2, is binomial distribution
# if dice_side>2 , is multinomial distribution
dice_side = 2
# if N becomes larger, then multinomial distribution will more like normal distribution
N = 100

counting = np.zeros(((dice_side - 1) * N + 1))

for i in range(30000):
 sum = 0
 for j in range(N):
  dice_result = np.random.randint(0, dice_side)
  sum += dice_result

 counting[sum] += 1

# normalization
counting /= np.sum(counting)
plot_bar_x()
以上这篇python 计算概率密度、累计分布、逆函数的例子就是小编分享给大家的全部内容了,希望能给大家一个参考,也希望大家多多支持自学编程网。

- 本文固定链接: https://zxbcw.cn/post/181317/
- 转载请注明:必须在正文中标注并保留原文链接
- QQ群: PHP高手阵营官方总群(344148542)
- QQ群: Yii2.0开发(304864863)
