1.在搭建网络开始时,会调用到 keras.models的Sequential()方法,返回一个model参数表示模型
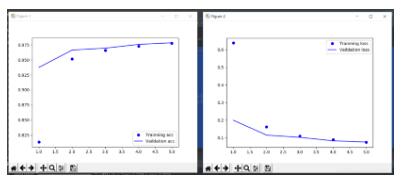
2.model参数里面有个fit()方法,用于把训练集传进网络。fit()返回一个参数,该参数包含训练集和验证集的准确性acc和错误值loss,用这些数据画成图表即可。
如:
history=model.fit(x_train, y_train, batch_size=32, epochs=5, validation_split=0.25) #获取数据

#########画图
acc = history.history['acc']  #获取训练集准确性数据
val_acc = history.history['val_acc'] #获取验证集准确性数据
loss = history.history['loss']   #获取训练集错误值数据
val_loss = history.history['val_loss'] #获取验证集错误值数据
epochs = range(1,len(acc)+1)
plt.plot(epochs,acc,'bo',label='Trainning acc')  #以epochs为横坐标,以训练集准确性为纵坐标
plt.plot(epochs,val_acc,'b',label='Vaildation acc') #以epochs为横坐标,以验证集准确性为纵坐标
plt.legend() #绘制图例,即标明图中的线段代表何种含义

plt.figure() #创建一个新的图表
plt.plot(epochs,loss,'bo',label='Trainning loss')
plt.plot(epochs,val_loss,'b',label='Vaildation loss')
plt.legend() ##绘制图例,即标明图中的线段代表何种含义

plt.show() #显示所有图表
得到效果:

完整代码:
import keras
from keras.datasets import mnist
from keras.layers import Conv2D, MaxPool2D, Dense, Flatten,Dropout
from keras.models import Sequential
import matplotlib.pyplot as plt

(x_train, y_train), (x_test, y_test) = mnist.load_data()
x_train = x_train.reshape(-1, 28, 28, 1)
x_test = x_test.reshape(-1, 28, 28, 1)
x_train = x_train / 255.
x_test = x_test / 255.

y_train = keras.utils.to_categorical(y_train)
y_test = keras.utils.to_categorical(y_test)

model = Sequential()
model.add(Conv2D(20,(5,5),strides=(1,1),input_shape=(28,28,1),padding='valid',activation='relu',kernel_initializer='uniform'))
model.add(MaxPool2D(pool_size=(2,2),strides=(2,2)))
model.add(Conv2D(64,(5,5),strides=(1,1),padding='valid',activation='relu',kernel_initializer='uniform'))
model.add(MaxPool2D(pool_size=(2,2),strides=(2,2)))
model.add(Flatten())
model.add(Dense(500,activation='relu'))
model.add(Dropout(0.2))
model.add(Dense(10,activation='softmax'))
model.compile('sgd', loss='categorical_crossentropy', metrics=['accuracy']) #随机梯度下降

history=model.fit(x_train, y_train, batch_size=32, epochs=5, validation_split=0.25) #获取数据

#########画图
acc = history.history['acc']  #获取训练集准确性数据
val_acc = history.history['val_acc'] #获取验证集准确性数据
loss = history.history['loss']   #获取训练集错误值数据
val_loss = history.history['val_loss'] #获取验证集错误值数据
epochs = range(1,len(acc)+1)
plt.plot(epochs,acc,'bo',label='Trainning acc')  #以epochs为横坐标,以训练集准确性为纵坐标
plt.plot(epochs,val_acc,'b',label='Vaildation acc') #以epochs为横坐标,以验证集准确性为纵坐标
plt.legend() #绘制图例,即标明图中的线段代表何种含义

plt.figure() #创建一个新的图表
plt.plot(epochs,loss,'bo',label='Trainning loss')
plt.plot(epochs,val_loss,'b',label='Vaildation loss')
plt.legend() ##绘制图例,即标明图中的线段代表何种含义
以上这篇使用Keras画神经网络准确性图教程就是小编分享给大家的全部内容了,希望能给大家一个参考,也希望大家多多支持自学编程网。

- 本文固定链接: https://zxbcw.cn/post/188710/
- 转载请注明:必须在正文中标注并保留原文链接
- QQ群: PHP高手阵营官方总群(344148542)
- QQ群: Yii2.0开发(304864863)
