
基本设置
class Map3D(
    # 初始化配置项,参考 `global_options.InitOpts`
    init_opts: opts.InitOpts = opts.InitOpts()
)

def add(
    # 系列名称,用于 tooltip 的显示,legend 的图例筛选。
    series_name: str,

    # 数据项 (坐标点名称,坐标点值)
    data_pair: types.Sequence,

    # 叠加图的类型(目前只支持 Bar3D,Line3D,Lines3D,Scatter3D)
    type_: ChartType = None,

    # 地图类型,具体参考 pyecharts.datasets.map_filenames.json 文件
    maptype: str = "china",

    # 是否选中图例
    is_selected: bool = True,

    # 是否显示标记图形
    is_map_symbol_show: bool = True,

    # 使用的 grid3D 组件的索引。默认使用第一个 grid3D 组件。
    grid_3d_index: types.Numeric = 0,

    # 坐标轴使用的 geo3D 组件的索引。默认使用第一个 geo3D 组件。
    geo_3d_index: types.Numeric = 0,

    # 坐标轴使用的 globe 组件的索引。默认使用第一个 globe 组件。
    globe_index: types.Numeric = 0,

    # 仅在 bar3D 下起作用
    # 设置柱子的大小
    bar_size: types.Optional[types.Numeric] = None,

    # 仅在 bar3D 下起作用
    # 柱子的倒角尺寸。支持设置为从 0 到 1 的值。默认为 0,即没有倒角。
    bevel_size: types.Numeric = 0,

    # 仅在 bar3D 下起作用
    # 柱子倒角的光滑/圆润度,数值越大越光滑/圆润。
    bevel_smoothness: types.Numeric = 2,

    # 仅在 bar3D 下起作用
    # 柱状图堆叠,相同 stack 值的柱状图系列数据会有叠加。
    # 注意不同系列需要叠加的数据项在数组中的索引必须是一样的。
    stack: types.Optional[str] = None,

    # 仅在 bar3D 下起作用
    # 最小柱子高度。
    min_height: types.Numeric = 2,

    # 仅在 Scatter3D 起作用;
    # 散点的形状。默认为圆形。
    # ECharts 提供的标记类型包括 'circle', 'rect', 'roundRect', 'triangle', 'diamond', 'pin', 'arrow', 'none'
    # 可以通过 'path://' 将图标设置为任意的矢量路径。
    # 这种方式相比于使用图片的方式,不用担心因为缩放而产生锯齿或模糊,而且可以设置为任意颜色。
    # 路径图形会自适应调整为合适(如果是 symbol 的话就是 symbolSize)的大小。
    symbol: str = "circle",

    # 仅在 Scatter3D 起作用;
    # 标记的大小,可以设置成诸如 10 这样单一的数字,也可以用数组分开表示宽和高,例如 [20, 10] 表示标记宽为20,高为10。
    symbol_size: types.Union[types.Numeric, types.Sequence, types.JSFunc] = 10,

    # 混合模式,目前支持'source-over','lighter'。
    # 默认使用的'source-over'是通过 alpha 混合。
    # 而'lighter'是叠加模式,该模式可以让数据集中的区域因为叠加而产生高亮的效果。
    blend_mode: str = "source-over",

    # 仅在 Lines3D 起作用
    # 是否是多段线。
    # 默认为 false,只能用于绘制只有两个端点的线段(表现为被赛尔曲线)。
    # 如果该配置项为 true,则可以在 data.coords 中设置多于 2 个的顶点用来绘制多段线,在绘制路线轨迹的时候比较有用。
    is_polyline: bool = False,

    # 仅在 Lines3D 起作用
    # 飞线的尾迹特效,参考 `series_options.Line3DEffectOpts`
    effect: types.Lines3DEffect = None,

    # 仅在 Line3D,Lines3D 起作用
    # 飞线的线条样式,参考 `series_options.LineStyleOpts`
    linestyle_opts: types.LineStyle = opts.LineStyleOpts(),

    # 仅在 Scatter3D,Bar3D,Map3D 起作用
    # 标签配置项,参考 `series_options.LabelOpts`
    label_opts: types.Label = opts.LabelOpts(),

    # 提示框组件配置项,参考 `series_options.TooltipOpts`
    tooltip_opts: types.Tooltip = None,

    # 仅在 Scatter3D,Bar3D,Map3D 起作用
    # 图元样式配置项,参考 `series_options.ItemStyleOpts`
    itemstyle_opts: types.ItemStyle = None,

    # 仅在 Scatter3D,Bar3D,Map3D 起作用
    # 高亮标签配置项,参考 `series_options.LabelOpts`
    emphasis_label_opts: types.Label = None,

    # 仅在 Scatter3D,Bar3D,Map3D 起作用
    # 高亮图元样式配置项,参考 `series_options.ItemStyleOpts`
    emphasis_itemstyle_opts: types.ItemStyle = None,

    # 三维地图中三维图形的着色效果。echarts-gl 中支持下面三种着色方式:
    # color: 只显示颜色,不受光照等其它因素的影响。
    # lambert: 通过经典的 lambert 着色表现光照带来的明暗。
    # realistic: 真实感渲染,配合 light.ambientCubemap 和 postEffect 使用可以让展示的画面效果和质感有质的提升。
    # ECharts GL 中使用了基于物理的渲染(PBR) 来表现真实感材质。
    shading: types.Optional[str] = None,

    # 真实感材质相关的配置项,在 shading 为'realistic'时有效。
    realistic_material_opts: types.Optional[types.Map3DRealisticMaterial] = None,

    # lambert 材质相关的配置项,在 shading 为'lambert'时有效。
    lambert_material_opts: types.Optional[types.Map3DLambertMaterial] = None,

    # color 材质相关的配置项,在 shading 为'color'时有效。
    color_material_opts: types.Optional[types.Map3DColorMaterial] = None,

    # 组件所在的层。
    zlevel: types.Numeric = -10,

    # 图形是否不响应和触发鼠标事件,默认为 false,即响应和触发鼠标事件。
    is_silent: bool = False,

    # 是否开启动画。
    is_animation: bool = True,

    # 过渡动画的时长。
    animation_duration_update: types.Numeric = 100,

    # 过渡动画的缓动效果。
    animation_easing_update: types.Numeric = "cubicOut",
)

def add_schema(
    # 地图类型,具体参考 pyecharts.datasets.map_filenames.json 文件
    maptype: str = "china",

    # 名称
    name: types.Optional[str] = None,

    # 三维地理坐标系组件在三维场景中的宽度。
    # 具体图示在此: https://www.echartsjs.com/zh/documents/asset/gl/img/geo-size.png
    box_width: types.Optional[types.Numeric] = 100,

    # 三维地理坐标系组件在三维场景中的高度。
    # 组件高度。这个高度包含三维地图上的柱状图、散点图的高度。
    box_height: types.Optional[types.Numeric] = 10,

    # 三维地理坐标系组件在三维场景中的深度。
    # 组件深度默认自动,保证三维组件的显示比例跟输入的 GeoJSON 的比例相同。
    box_depth: types.Optional[types.Numeric] = None,

    # 三维地图每个区域的高度。这个高度是模型的高度,小于 boxHeight。
    # boxHeight - regionHeight 这一片区域会被用于三维柱状图,散点图等的展示。
    region_height: types.Optional[types.Numeric] = 3,

    # 环境贴图。支持纯色、渐变色、全景贴图的 url。
    # 默认为 'auto',在配置有 light.ambientCubemap.texture 的时候会使用该纹理作为环境贴图。
    # 否则则不显示环境贴图。
    # 示例:
    #  // 配置为全景贴图
    #  environment: 'asset/starfield.jpg'
    #  // 配置为纯黑色的背景
    #  environment: '#000'
    #  // 配置为垂直渐变的背景
    #  environment: new echarts.graphic.LinearGradient(0, 0, 0, 1, [{
    #    offset: 0, color: '#00aaff' // 天空颜色
    #  }, {
    #    offset: 0.7, color: '#998866' // 地面颜色
    #  }, {
    #    offset: 1, color: '#998866' // 地面颜色
    #  }], false)
    environment: types.Optional[types.JSFunc] = None,

    # 是否显示地面。
    # 地面可以让整个组件有个“摆放”的地方,从而使整个场景看起来更真实,更有模型感。
    is_show_ground: bool = False,

    # 地面颜色。
    ground_color: str = "#aaa",

    # instancing会将 GeoJSON 中所有的 geometry 合并成一个
    # 在 GeoJSON 拥有特别多(上千)的 geometry 时可以有效提升绘制效率。
    is_instancing: bool = False,

    # Map3D 的 Label 设置
    map3d_label: types.Map3DLabel = None,

    # 图元样式配置项,参考 `series_options.ItemStyleOpts`
    itemstyle_opts: types.ItemStyle = None,

    # 高亮标签配置项,参考 `series_options.LabelOpts`
    emphasis_label_opts: types.Label = None,

    # 高亮图元样式配置项,参考 `series_options.ItemStyleOpts`
    emphasis_itemstyle_opts: types.ItemStyle = None,

    # 三维地理坐标系组件中三维图形的着色效果。echarts-gl 中支持下面三种着色方式:
    # color: 只显示颜色,不受光照等其它因素的影响。
    # lambert: 通过经典的 lambert 着色表现光照带来的明暗。
    # realistic: 真实感渲染,配合 light.ambientCubemap 和 postEffect 使用可以让展示的画面效果和质感有质的提升。
    # ECharts GL 中使用了基于物理的渲染(PBR) 来表现真实感材质。
    shading: types.Optional[str] = None,

    # 真实感材质相关的配置项,在 shading 为'realistic'时有效。
    realistic_material_opts: types.Optional[types.Map3DRealisticMaterial] = None,

    # lambert 材质相关的配置项,在 shading 为'lambert'时有效。
    lambert_material_opts: types.Optional[types.Map3DLambertMaterial] = None,

    # color 材质相关的配置项,在 shading 为'color'时有效。
    color_material_opts: types.Optional[types.Map3DColorMaterial] = None,

    # 光照相关的设置。在 shading 为 'color' 的时候无效。
    # 光照的设置会影响到组件以及组件所在坐标系上的所有图表。
    # 合理的光照设置能够让整个场景的明暗变得更丰富,更有层次。
    light_opts: types.Optional[types.Map3DLight] = None,

    # 后处理特效的相关配置。后处理特效可以为画面添加高光、景深、环境光遮蔽(SSAO)、调色等效果。可以让整个画面更富有质感。
    post_effect_opts: types.Optional[types.Map3DPostEffect] = None,

    # 是否开启分帧超采样。默认在开启 postEffect 后也会同步开启。
    is_enable_super_sampling: types.Union[str, bool] = "auto",

    # viewControl用于鼠标的旋转,缩放等视角控制。
    view_control_opts: types.Optional[types.Map3DViewControl] = None,

    # 组件所在的层。
    zlevel: types.Optional[types.Numeric] = -10,

    # 组件的视图离容器左侧的距离。
    # left 的值可以是像 20 这样的具体像素值,可以是像 '20%' 这样相对于容器高宽的百分比,
    # 也可以是 'left', 'center', 'right'。
    # 如果 left 的值为'left', 'center', 'right',组件会根据相应的位置自动对齐。
    pos_left: types.Union[types.Numeric, str] = "auto",

    # 组件的视图离容器上侧的距离。
    pos_top: types.Union[types.Numeric, str] = "auto",

    # 组件的视图离容器右侧的距离。
    pos_right: types.Union[types.Numeric, str] = "auto",

    # 组件的视图离容器下侧的距离。
    pos_bottom: types.Union[types.Numeric, str] = "auto",

    # 组件的视图宽度。
    pos_width: types.Union[types.Numeric, str] = "auto",

    # 组件的视图高度。
    pos_height: types.Union[types.Numeric, str] = "auto",
)

class Map3DLabelOpts(
    # 是否显示标签。
    is_show: bool = True,

    # 标签距离图形的距离,在三维的散点图中这个距离是屏幕空间的像素值,其它图中这个距离是相对的三维距离。
    distance: Numeric = None,

    # 标签内容格式器,支持字符串模板和回调函数两种形式,字符串模板与回调函数返回的字符串均支持用 \n 换行。
    # 模板变量有:
    # {a}:系列名。
    # {b}:数据名。
    # {c}:数据值。
    formatter: Optional[JSFunc] = None,

    # 标签的字体样式。
    text_style: Union[TextStyleOpts, dict, None] = None,
)

class Map3DRealisticMaterialOpts(
    # 材质细节的纹理贴图。
    detail_texture: Optional[JSFunc] = None,

    # 材质细节纹理的平铺。默认为1,也就是拉伸填满。大于 1 的时候,数字表示纹理平铺重复的次数。
    # 注: 使用平铺需要 detailTexture 的高宽是 2 的 n 次方。例如 512x512,如果是 200x200 的纹理无法使用平铺。
    texture_tiling: Numeric = 1,

    # 材质细节纹理的位移。
    texture_offset: Numeric = 0,

    # roughness 属性用于表示材质的粗糙度,0为完全光滑,1完全粗糙,中间的值则是介于这两者之间。
    roughness: Numeric = 0.5,

    # metalness属性用于表示材质是金属还是非金属,0为非金属,1为金属,中间的值则是介于这两者之间。
    # 通常设成0和1就能满足大部分场景了。
    metalness: Numeric = 0,

    # 粗糙度调整,在使用粗糙度贴图的时候有用。可以对贴图整体的粗糙度进行调整。
    # 默认为 0.5,0的时候为完全光滑,1的时候为完全粗糙。
    roughness_adjust: Numeric = 0.5,

    # 金属度调整,在使用金属度贴图的时候有用。可以对贴图整体的金属度进行调整。
    # 默认为 0.5,0的时候为非金属,1的时候为金属。
    metalness_adjust: Numeric = 0.5,

    # 材质细节的法线贴图。
    # 使用法线贴图可以在较少的顶点下依然表现出物体表面丰富的明暗细节。
    normal_texture: Optional[JSFunc] = None,
)


class Map3DLambertMaterialOpts(
    # 材质细节的纹理贴图。
    detail_texture: Optional[JSFunc] = None,

    # 材质细节纹理的平铺。默认为1,也就是拉伸填满。大于 1 的时候,数字表示纹理平铺重复的次数。
    # 注: 使用平铺需要 detailTexture 的高宽是 2 的 n 次方。例如 512x512,如果是 200x200 的纹理无法使用平铺。
    texture_tiling: Numeric = 1,

    # 材质细节纹理的位移。
    texture_offset: Numeric = 0,
)

class Map3DColorMaterialOpts(
    # 材质细节的纹理贴图。
    detail_texture: Optional[JSFunc] = None,

    # 材质细节纹理的平铺。默认为1,也就是拉伸填满。大于 1 的时候,数字表示纹理平铺重复的次数。
    # 注: 使用平铺需要 detailTexture 的高宽是 2 的 n 次方。例如 512x512,如果是 200x200 的纹理无法使用平铺。
    texture_tiling: Numeric = 1,

    # 材质细节纹理的位移。
    texture_offset: Numeric = 0,
)

class Map3DLightOpts(
    # 主光源的颜色。
    main_color: str = "#fff",

    # 主光源的强度。
    main_intensity: Numeric = 1,

    # 主光源是否投射阴影。默认为关闭。
    # 开启阴影可以给场景带来更真实和有层次的光照效果。但是同时也会增加程序的运行开销。
    is_main_shadow: bool = False,

    # 阴影的质量。可选'low', 'medium', 'high', 'ultra'
    main_shadow_quality: str = "medium",

    # 主光源绕 x 轴,即上下旋转的角度。配合 beta 控制光源的方向。
    # 图示: https://www.echartsjs.com/zh/documents/asset/gl/img/light-alpha-beta.png
    main_alpha: Numeric = 40,

    # 主光源绕 y 轴,即左右旋转的角度。
    main_beta: Numeric = 40,

    # 环境光的颜色。
    ambient_color: str = "#fff",

    # 环境光的强度。
    ambient_intensity: Numeric = 0.2,

    # 环境光贴图的 url,支持使用.hdr格式的 HDR 图片。
    # 可以从 http://www.hdrlabs.com/sibl/archive.html 等网站获取 .hdr 的资源。
    ambient_cubemap_texture: Optional[str] = None,

    # 漫反射的强度。
    ambient_cubemap_diffuse_intensity: Numeric = 0.5,

    # 高光反射的强度。
    ambient_cubemap_specular_intensity: Numeric = 0.5,
)

class Map3DPostEffectOpts(
    # 是否开启后处理特效。默认关闭。
    is_enable: bool = False,

    # 是否开启光晕特效。
    is_bloom_enable: bool = False,

    # 光晕的强度,默认为 0.1
    bloom_intensity: Numeric = 0.1,

    # 是否开启景深。
    is_depth_field_enable: bool = False,

    # 初始的焦距,用户可以点击区域自动聚焦。
    depth_field_focal_distance: Numeric = 50,

    # 完全聚焦的区域范围,在此范围内的物体时完全清晰的,不会有模糊
    depth_field_focal_range: Numeric = 20,

    # 镜头的F值,值越小景深越浅。
    depth_field_fstop: Numeric = 2.8,

    # 焦外的模糊半径
    depth_field_blur_radius: Numeric = 10,

    # 是否开启环境光遮蔽。默认不开启。
    is_ssao_enable: bool = False,

    # 环境光遮蔽的质量。支持'low', 'medium', 'high', 'ultra'。
    ssao_quality: str = "medium",

    # 环境光遮蔽的采样半径。半径越大效果越自然,但是需要设置较高的'quality'。
    ssao_radius: Numeric = 2,

    # 环境光遮蔽的强度。值越大颜色越深。
    ssao_intensity: Numeric = 1,

    # 是否开启颜色纠正。
    is_color_correction_enable: bool = False,

    # 参考 Echarts 官方解释。
    # 地址:https://www.echartsjs.com/zh/option-gl.html#geo3D.postEffect.colorCorrection.lookupTexture
    color_correction_lookup_texture: Optional[JSFunc] = None,

    # 画面的曝光。
    color_correction_exposure: Numeric = 0,

    # 画面的亮度。
    color_correction_brightness: Numeric = 0,

    # 画面的对比度。
    color_correction_contrast: Numeric = 1,

    # 画面的饱和度。
    color_correction_saturation: Numeric = 1,

    # 是否开启 FXAA。默认为不开启。
    is_fxaa_enable: bool = False,
)

class Map3DViewControlOpts(
    # 投影方式,默认为透视投影'perspective',也支持设置为正交投影'orthographic'。
    projection: str = "perspective",

    # 是否开启视角绕物体的自动旋转查看。
    auto_rotate: bool = False,

    # 物体自转的方向。默认是 'cw' 也就是从上往下看是顺时针方向,也可以取 'ccw',既从上往下看为逆时针方向。
    auto_rotate_direction: str = "cw",

    # 物体自转的速度。单位为角度 / 秒,默认为10 ,也就是36秒转一圈。
    auto_rotate_speed: Numeric = 10,

    # 在鼠标静止操作后恢复自动旋转的时间间隔。在开启 autoRotate 后有效。
    auto_rotate_after_still: Numeric = 3,

    # 鼠标进行旋转,缩放等操作时的迟滞因子,在大于 0 的时候鼠标在停止操作后,视角仍会因为一定的惯性继续运动(旋转和缩放)。
    damping: Numeric = 0.8,

    # 旋转操作的灵敏度,值越大越灵敏。支持使用数组分别设置横向和纵向的旋转灵敏度。
    # 默认为1。
    # 设置为0后无法旋转。
    # // 无法旋转
    # rotateSensitivity: 0
    # // 只能横向旋转
    # rotateSensitivity: [1, 0]
    # // 只能纵向旋转
    # rotateSensitivity: [0, 1]
    rotate_sensitivity: Union[Numeric, Sequence] = 1,

    # 缩放操作的灵敏度,值越大越灵敏。默认为1。
    # 设置为0后无法缩放。
    zoom_sensitivity: Numeric = 1,

    # 平移操作的灵敏度,值越大越灵敏。支持使用数组分别设置横向和纵向的平移灵敏度
    # 默认为1。
    # 设置为0后无法平移。
    pan_sensitivity: Numeric = 1,

    # 平移操作使用的鼠标按键,支持:
    #  'left' 鼠标左键(默认)
    #  'middle' 鼠标中键
    #  'right' 鼠标右键
    #  注意:如果设置为鼠标右键则会阻止默认的右键菜单。
    pan_mouse_button: str = "left",

    # 旋转操作使用的鼠标按键,支持:
    #  'left' 鼠标左键(默认)
    #  'middle' 鼠标中键
    #  'right' 鼠标右键
    #  注意:如果设置为鼠标右键则会阻止默认的右键菜单。
    rotate_mouse_button: str = "middle",

    # 默认视角距离主体的距离,对于 globe 来说是距离地球表面的距离
    # 对于 grid3D 和 geo3D 等其它组件来说是距离中心原点的距离。
    # 在 projection 为'perspective'的时候有效。
    distance: Numeric = 100,

    # 视角通过鼠标控制能拉近到主体的最小距离。在 projection 为'perspective'的时候有效。
    min_distance: Numeric = 40,

    # 视角通过鼠标控制能拉远到主体的最大距离。在 projection 为'perspective'的时候有效。
    max_distance: Numeric = 400,

    # 正交投影的大小。在 projection 为'orthographic'的时候有效。
    orthographic_size: Numeric = 100,

    # 正交投影缩放的最大值。在 projection 为'orthographic'的时候有效。
    min_orthographic_size: Numeric = 20,

    # 正交投影缩放的最小值。在 projection 为'orthographic'的时候有效。
    max_orthographic_size: Numeric = 400,

    # 视角绕 x 轴,即上下旋转的角度。配合 beta 可以控制视角的方向。
    alpha: Numeric = 40,

    # 视角绕 y 轴,即左右旋转的角度。
    beta: Numeric = 0,

    # 视角中心点,旋转也会围绕这个中心点旋转,默认为[0,0,0]。
    center: Optional[Sequence] = None,

    # 上下旋转的最小 alpha 值。即视角能旋转到达最上面的角度。
    min_alpha: Numeric = 5,

    # 上下旋转的最大 alpha 值。即视角能旋转到达最下面的角度。
    max_alpha: Numeric = 90,

    # 左右旋转的最小 beta 值。即视角能旋转到达最左的角度。
    min_beta: Numeric = -80,

    # 左右旋转的最大 beta 值。即视角能旋转到达最右的角度。
    max_beta: Numeric = 80,

    # 是否开启动画。
    animation: bool = True,

    # 过渡动画的时长。
    animation_duration_update: Numeric = 1000,

    # 过渡动画的缓动效果。
    animation_easing_update: str = "cubicInOut",
)
Demo 举例
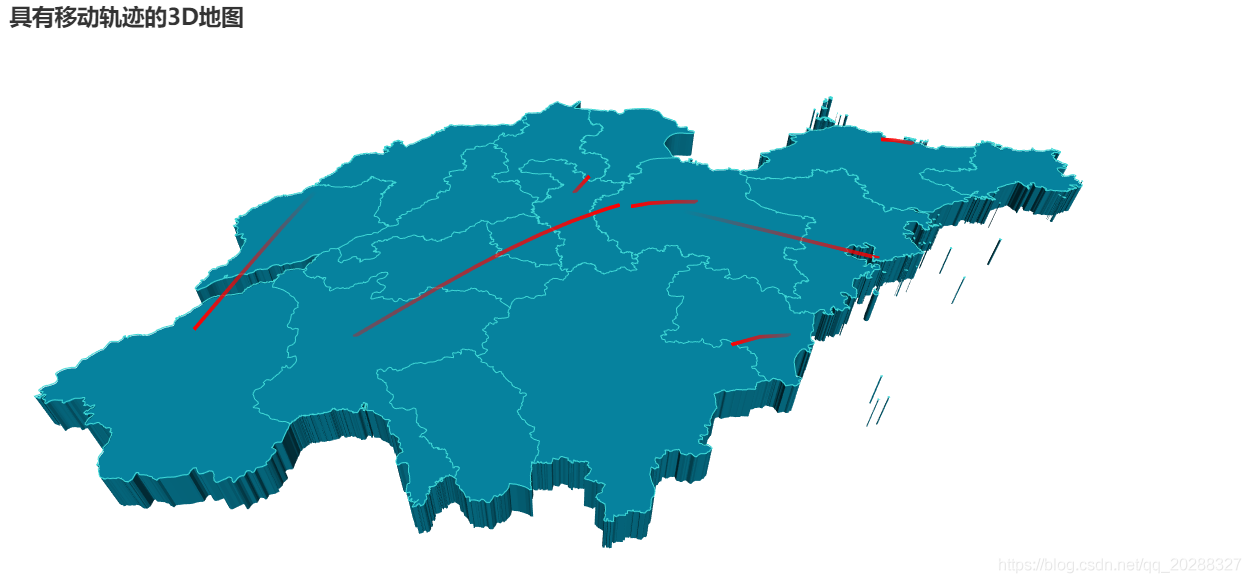
1.具有移动轨迹的3D地图
example_data = [
    [[119.107078, 36.70925, 1000], [116.587245, 35.415393, 1000]],
    [[117.000923, 36.675807], [120.355173, 36.082982]],
    [[118.047648, 36.814939], [118.66471, 37.434564]],
    [[121.391382, 37.539297], [119.107078, 36.70925]],
    [[116.587245, 35.415393], [122.116394, 37.509691]],
    [[119.461208, 35.428588], [118.326443, 35.065282]],
    [[116.307428, 37.453968], [115.469381, 35.246531]],
]

from pyecharts import options as opts
from pyecharts.charts import Map3D
from pyecharts.globals import ChartType


c = (
    Map3D()
    .add_schema(
        maptype="山东",
        itemstyle_opts=opts.ItemStyleOpts(
            color="rgb(5,101,123)",
            opacity=1,
            border_width=0.8,
            border_color="rgb(62,215,213)",
        ),
        light_opts=opts.Map3DLightOpts(
            main_color="#fff",
            main_intensity=1.2,
            is_main_shadow=False,
            main_alpha=55,
            main_beta=10,
            ambient_intensity=0.3,
        ),
        view_control_opts=opts.Map3DViewControlOpts(center=[-10, 0, 10]),
        post_effect_opts=opts.Map3DPostEffectOpts(is_enable=False),
    )
    .add(
        series_name="",
        data_pair=example_data,
        type_=ChartType.LINES3D,
        effect=opts.Lines3DEffectOpts(
            is_show=True,
            period=4,
            trail_width=3,
            trail_length=0.5,
            trail_color="#f00",
            trail_opacity=1,
        ),
        linestyle_opts=opts.LineStyleOpts(is_show=False, color="#fff", opacity=0),
    )
    .set_global_opts(title_opts=opts.TitleOpts(title="具有移动轨迹的3D地图"))
#     .render("具有移动轨迹的3D地图.html")
)
c.render_notebook()
2.数据标记点的3D地图
example_data = [
    ("黑龙江", [127.9688, 45.368, 100]),
    ("内蒙古", [110.3467, 41.4899, 100]),
    ("吉林", [125.8154, 44.2584, 100]),
    ("辽宁", [123.1238, 42.1216, 100]),
    ("河北", [114.4995, 38.1006, 100]),
    ("天津", [117.4219, 39.4189, 100]),
    ("山西", [112.3352, 37.9413, 100]),
    ("陕西", [109.1162, 34.2004, 100]),
    ("甘肃", [103.5901, 36.3043, 100]),
    ("宁夏", [106.3586, 38.1775, 100]),
    ("青海", [101.4038, 36.8207, 100]),
    ("新疆", [87.9236, 43.5883, 100]),
    ("西藏", [91.11, 29.97, 100]),
    ("四川", [103.9526, 30.7617, 100]),
    ("重庆", [108.384366, 30.439702, 100]),
    ("山东", [117.1582, 36.8701, 100]),
    ("河南", [113.4668, 34.6234, 100]),
    ("江苏", [118.8062, 31.9208, 100]),
    ("安徽", [117.29, 32.0581, 100]),
    ("湖北", [114.3896, 30.6628, 100]),
    ("浙江", [119.5313, 29.8773, 100]),
    ("福建", [119.4543, 25.9222, 100]),
    ("江西", [116.0046, 28.6633, 100]),
    ("湖南", [113.0823, 28.2568, 100]),
    ("贵州", [106.6992, 26.7682, 100]),
    ("广西", [108.479, 23.1152, 100]),
    ("海南", [110.3893, 19.8516, 100]),
    ("上海", [121.4648, 31.2891, 100]),
]

from pyecharts import options as opts
from pyecharts.charts import Map3D
from pyecharts.globals import ChartType
from pyecharts.commons.utils import JsCode


c = (
    Map3D()
    .add_schema(
        itemstyle_opts=opts.ItemStyleOpts(
            color="rgb(5,101,123)",
            opacity=1,
            border_width=0.8,
            border_color="rgb(62,215,213)",
        ),
        map3d_label=opts.Map3DLabelOpts(
            is_show=False,
            formatter=JsCode("function(data){return data.name + " " + data.value[2];}"),
        ),
        emphasis_label_opts=opts.LabelOpts(
            is_show=False,
            color="#fff",
            font_size=10,
            background_color="rgba(0,23,11,0)",
        ),
        light_opts=opts.Map3DLightOpts(
            main_color="#fff",
            main_intensity=1.2,
            main_shadow_quality="high",
            is_main_shadow=False,
            main_beta=10,
            ambient_intensity=0.3,
        ),
    )
    .add(
        series_name="Scatter3D",
        data_pair=example_data,
        type_=ChartType.SCATTER3D,
        bar_size=1,
        shading="lambert",
        label_opts=opts.LabelOpts(
            is_show=False,
            formatter=JsCode("function(data){return data.name + ' ' + data.value[2];}"),
        ),
    )
    .set_global_opts(title_opts=opts.TitleOpts(title="数据标记点的3D地图"))
#     .render("数据标记点的3D地图.html")
)
c.render_notebook()
3.3D柱状图的3D地图
example_data = [
    ("黑龙江", [127.9688, 45.368, 100]),
    ("内蒙古", [110.3467, 41.4899, 300]),
    ("吉林", [125.8154, 44.2584, 300]),
    ("辽宁", [123.1238, 42.1216, 300]),
    ("河北", [114.4995, 38.1006, 300]),
    ("天津", [117.4219, 39.4189, 300]),
    ("山西", [112.3352, 37.9413, 300]),
    ("陕西", [109.1162, 34.2004, 300]),
    ("甘肃", [103.5901, 36.3043, 300]),
    ("宁夏", [106.3586, 38.1775, 300]),
    ("青海", [101.4038, 36.8207, 300]),
    ("新疆", [87.9236, 43.5883, 300]),
    ("西藏", [91.11, 29.97, 300]),
    ("四川", [103.9526, 30.7617, 300]),
    ("重庆", [108.384366, 30.439702, 300]),
    ("山东", [117.1582, 36.8701, 300]),
    ("河南", [113.4668, 34.6234, 300]),
    ("江苏", [118.8062, 31.9208, 300]),
    ("安徽", [117.29, 32.0581, 300]),
    ("湖北", [114.3896, 30.6628, 300]),
    ("浙江", [119.5313, 29.8773, 300]),
    ("福建", [119.4543, 25.9222, 300]),
    ("江西", [116.0046, 28.6633, 300]),
    ("湖南", [113.0823, 28.2568, 300]),
    ("贵州", [106.6992, 26.7682, 300]),
    ("广西", [108.479, 23.1152, 300]),
    ("海南", [110.3893, 19.8516, 300]),
    ("上海", [121.4648, 31.2891, 1300]),
]

from pyecharts import options as opts
from pyecharts.charts import Map3D
from pyecharts.globals import ChartType
from pyecharts.commons.utils import JsCode


c = (
    Map3D()
    .add_schema(
        itemstyle_opts=opts.ItemStyleOpts(
            color="rgb(5,101,123)",
            opacity=1,
            border_width=0.8,
            border_color="rgb(62,215,213)",
        ),
        map3d_label=opts.Map3DLabelOpts(
            is_show=False,
            formatter=JsCode("function(data){return data.name + " " + data.value[2];}"),
        ),
        emphasis_label_opts=opts.LabelOpts(
            is_show=False,
            color="#fff",
            font_size=10,
            background_color="rgba(0,23,11,0)",
        ),
        light_opts=opts.Map3DLightOpts(
            main_color="#fff",
            main_intensity=1.2,
            main_shadow_quality="high",
            is_main_shadow=False,
            main_beta=10,
            ambient_intensity=0.3,
        ),
    )
    .add(
        series_name="bar3D",
        data_pair=example_data,
        type_=ChartType.BAR3D,
        bar_size=1,
        shading="lambert",
        label_opts=opts.LabelOpts(
            is_show=False,
            formatter=JsCode("function(data){return data.name + ' ' + data.value[2];}"),
        ),
    )
    .set_global_opts(title_opts=opts.TitleOpts(title="3D柱状图的3D地图"))
#     .render("3D柱状图的3D地图.html")
)
c.render_notebook()
4.全国行政区划地图
from pyecharts import options as opts
from pyecharts.charts import Map3D
from pyecharts.globals import ChartType

c = (
    Map3D()
    .add_schema(
        itemstyle_opts=opts.ItemStyleOpts(
            color="rgb(5,101,123)",
            opacity=1,
            border_width=0.8,
            border_color="rgb(62,215,213)",
        ),
        map3d_label=opts.Map3DLabelOpts(
            is_show=True,
            text_style=opts.TextStyleOpts(
                color="#fff", font_size=16, background_color="rgba(0,0,0,0)"
            ),
        ),
        emphasis_label_opts=opts.LabelOpts(is_show=True),
        light_opts=opts.Map3DLightOpts(
            main_color="#fff",
            main_intensity=1.2,
            is_main_shadow=False,
            main_alpha=55,
            main_beta=10,
            ambient_intensity=0.3,
        ),
    )
    .add(series_name="", data_pair="", maptype=ChartType.MAP3D)
    .set_global_opts(
        title_opts=opts.TitleOpts(title="China 3D Map-Base"),
        visualmap_opts=opts.VisualMapOpts(is_show=False),
        tooltip_opts=opts.TooltipOpts(is_show=True),
    )
#     .render("全国行政区划地图.html")
)
c.render_notebook()
5.世界人口分布地图
import pyecharts.options as opts
from pyecharts.charts import MapGlobe
from pyecharts.faker import POPULATION

data = [x for _, x in POPULATION[1:]]
low, high = min(data), max(data)

c = (
    MapGlobe()
    .add_schema()
    .add(
        maptype="world",
        series_name="世界人口分布地图",
        data_pair=POPULATION[1:],
        is_map_symbol_show=False,
        label_opts=opts.LabelOpts(is_show=False),
    )
    .set_global_opts(
        visualmap_opts=opts.VisualMapOpts(
            min_=low,
            max_=high,
            range_text=["max", "min"],
            is_calculable=True,
            range_color=["lightskyblue", "yellow", "orangered"],
        )
    )
#     .render("世界人口分布地图.html")
)
c.render_notebook()

到此这篇关于详解如何使用Pyecharts制作Map3D的文章就介绍到这了,更多相关Pyecharts制作Map3D内容请搜索自学编程网以前的文章或继续浏览下面的相关文章希望大家以后多多支持自学编程网!

- 本文固定链接: https://47.98.125.4/post/215374/
- 转载请注明:必须在正文中标注并保留原文链接
- QQ群: PHP高手阵营官方总群(344148542)
- QQ群: Yii2.0开发(304864863)