
python–Folium
官方说明:folium.link.
- map用于生成地图,主要用到黄色的参数
Map(location=None, width=‘100%', height=‘100%', left=‘0%', top=‘0%', position=‘relative', tiles=‘OpenStreetMap', attr=None, min_zoom=0, max_zoom=18, zoom_start=10, min_lat=- 90, max_lat=90, min_lon=- 180, max_lon=180, max_bounds=False, crs=‘EPSG3857', control_scale=False, prefer_canvas=False, no_touch=False, disable_3d=False, jpg_enabled=False, zoom_control=True, **kwargs)
Parameters 参数说明
- location (tuple or list, default None) – Latitude and Longitude of Map (Northing, Easting).
- width (pixel int or percentage string (default: ‘100%')) – Width of the map.
- height (pixel int or percentage string (default: ‘100%')) – Height of the map.
- tiles (str, default ‘OpenStreetMap') – Map tileset to use. Can choose from a list of built-in tiles, pass a custom URL or pass None to create a map without tiles. For more advanced tile layer options, use the TileLayer class.
- min_zoom (int, default 0) – Minimum allowed zoom level for the tile layer that is created.
- max_zoom (int, default 18) – Maximum allowed zoom level for the tile layer that is created.
- zoom_start (int, default 10) – Initial zoom level for the map.
- attr (string, default None) – Map tile attribution; only required if passing custom tile URL.
- crs (str, default ‘EPSG3857') – Defines coordinate reference systems for projecting geographical points into pixel (screen) coordinates and back.定义坐标参考系统
- control_scale (bool, default False) – Whether to add a control scale on the map.
- prefer_canvas (bool, default False) – Forces Leaflet to use the Canvas back-end (if available) for vector layers instead of SVG.
- no_touch (bool, default False) – Forces Leaflet to not use touch events even if it detects them.
- disable_3d (bool, default False) – Forces Leaflet to not use hardware-accelerated CSS 3D transforms for positioning (which may cause glitches in some rare environments) even if they're supported.
- zoom_control (bool, default True) – Display zoom controls on the map.
basic example
m = folium.Map(location=[45.523, -122.675], width=750, height=500)

m = folium.Map(location=[45.523, -122.675], tiles='cartodb positron')

m = folium.Map(

   location=[45.523, -122.675],

   zoom_start=2,

   tiles='https://api.mapbox.com/v4/mapbox.streets/{z}/{x}/{y}.jpg?access_token=mytoken',

   attr='Mapbox attribution'
...)
Markers
m = folium.Map(location=[45.372, -121.6972], zoom_start=12, tiles="Stamen Terrain")

tooltip = "Click me!"

folium.Marker(
    [45.3288, -121.6625], popup="<i>Mt. Hood Meadows</i>", tooltip=tooltip
).add_to(m)
tooltip:点击标记后弹出的信息
popup:鼠标放标记上显示的信息

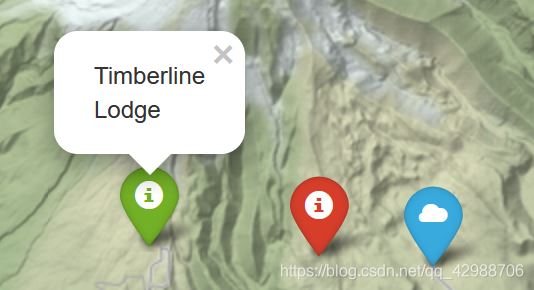
标记样式修改
m = folium.Map(location=[45.372, -121.6972], zoom_start=12, tiles="Stamen Terrain")

folium.Marker(
    location=[45.3288, -121.6625],
    popup="Mt. Hood Meadows",
    icon=folium.Icon(icon="cloud"),
).add_to(m)

folium.Marker(
    location=[45.3311, -121.7113],
    popup="Timberline Lodge",
    icon=folium.Icon(color="green"),
).add_to(m)

folium.Marker(
    location=[45.3300, -121.6823],
    popup="Some Other Location",
    icon=folium.Icon(color="red", icon="info-sign"),
).add_to(m)
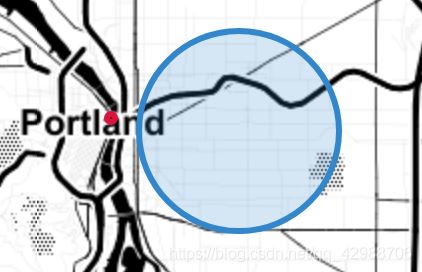
标记圆形区域
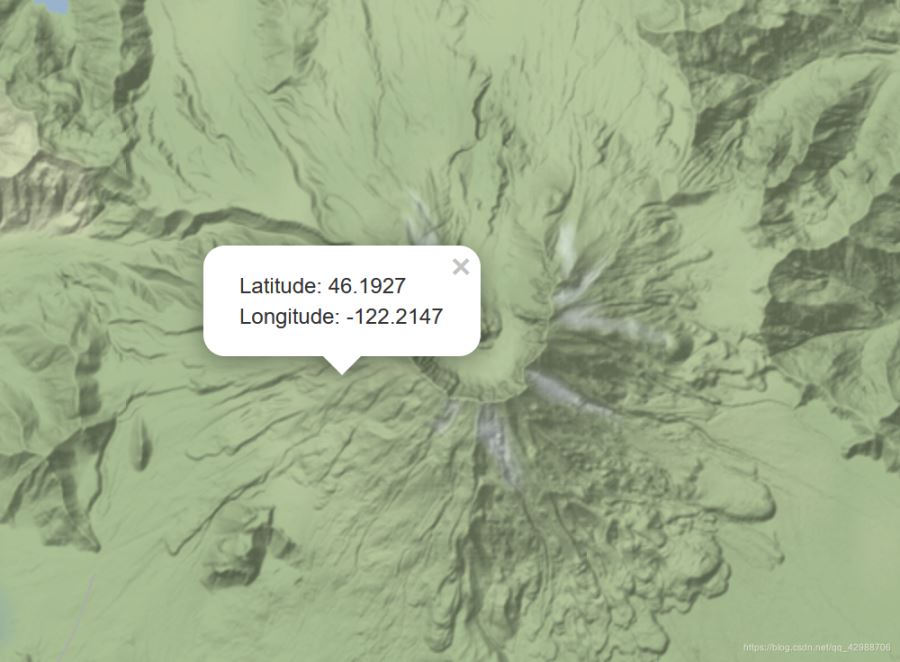
点击任意位置出现经纬度folium.LatLngPopup()
m = folium.Map(location=[46.1991, -122.1889], tiles="Stamen Terrain", zoom_start=13)

m.add_child(folium.LatLngPopup())
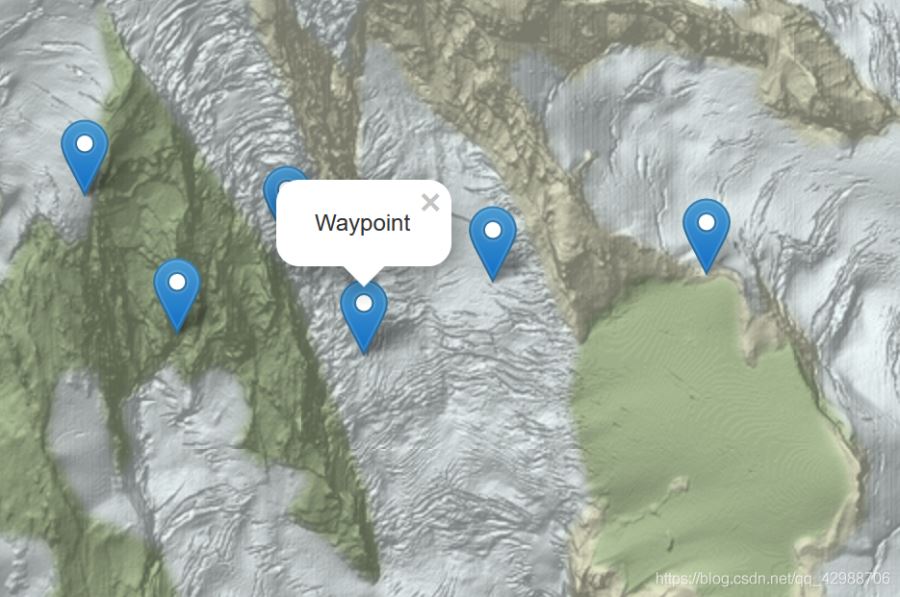
打点功能:点击任意位置出现标记,再点击弹出信息
m = folium.Map(location=[46.8527, -121.7649], tiles="Stamen Terrain", zoom_start=13)

folium.Marker([46.8354, -121.7325], popup="Camp Muir").add_to(m)

m.add_child(folium.ClickForMarker(popup="Waypoint"))
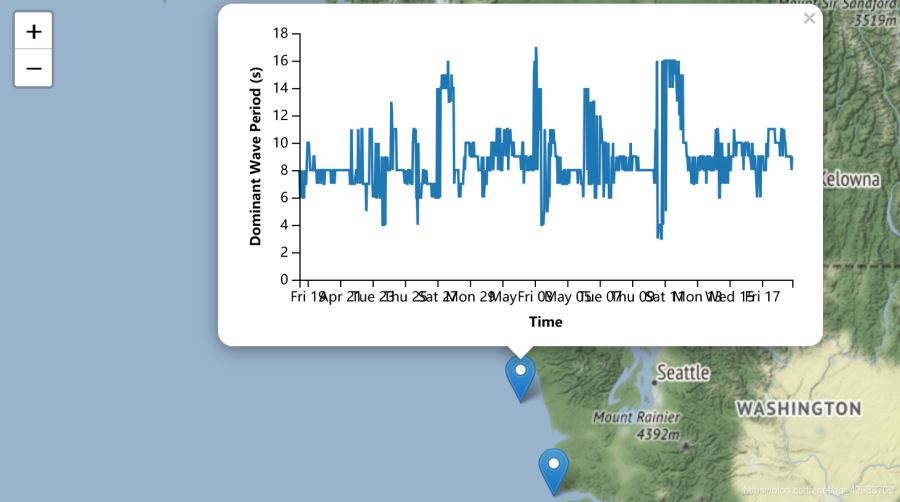
允许显示任何HTML对象
m = folium.Map(location=[46.3014, -123.7390], zoom_start=7, tiles="Stamen Terrain")

folium.Marker(
    location=[47.3489, -124.708],
    popup=folium.Popup(max_width=450).add_child(
        folium.Vega(vis1, width=450, height=250)
    ),
).add_to(m)
可以参考的代码
html参考链接
实战
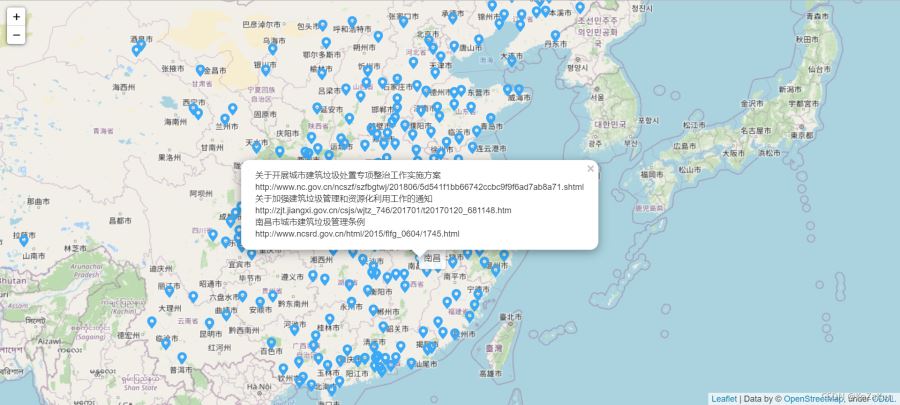
用folium绘制中国的政策地图,城市的政策汇总在一个excel表中。要实现的效果是政策可视化,点击某一个城市,可以弹出这个城市所有的政策。
import folium
import webbrowser as wb
import numpy as np
import xlrd
import pandas as pd
from folium import CustomIcon

def get_data():
    '''
    return:
    df_data:返回城市对应的编号,经纬度
    df_policy:返回城市的政策名称、链接、编号
    '''
    file_name = 'policy.xls'
    all_data = xlrd.open_workbook(file_name)
    table = all_data.sheet_by_name('num_lat_lon')
    df_data = pd.DataFrame(columns=['city','number','latitude','longitude'])
    for i in range(1,table.nrows):
        df_data.loc[i] = table.row_values(i)

    table_policy = all_data.sheet_by_name('policy')
    df_policy = pd.DataFrame(columns=['number','name','link'])
    for i in range(1,table_policy.nrows):
        df_policy.loc[i,'number'] = table_policy.cell(i,3).value
        df_policy.loc[i,'name'] = table_policy.cell(i,1).value
        df_policy.loc[i,'link'] = table_policy.cell(i,2).value

    return df_data, df_policy

    # 中文转换
def parse_zhch(s):
        return str(str(s).encode('ascii' , 'xmlcharrefreplace'))[2:-1]

def show_map(df_data,df_policy):
    '''
    可以使用高德地图或默认地图
    m = folium.Map(zoom_start=4,zoom_control=True,tiles='http://webrd02.is.autonavi.com/appmaptile?lang=zh_cn&size=1&scale=1&style=7&x={x}&y={y}&z={z}',attr='default')
    '''
    # 默认地图
    m = folium.Map(location=[39.904,116.408],zoom_start=4,zoom_control=True,tiles='OpenStreetMap')
    for i in range(1,len(df_data)):
        # 得到该城市的编号、经纬度
        number = df_data.loc[i,'number']
        latitude = df_data.loc[i,'latitude']
        longitude = df_data.loc[i,'longitude']
        tip = df_data.loc[i,'city']

        # 获取城市编号对应的所有政策和链接的行索引
        city_index = df_policy[df_policy.number == number].index.tolist()
        # 将城市名称和链接放同一个list中
        s=[]
        for i in city_index:
            s.append(df_policy.loc[i,'name'])
            s.append(df_policy.loc[i,'link'])
        # 计算最大长度
        length = []
        for i in range(len(s)):
            length.append(len(s[i]))
        WIDTH = max(length)
        # 点击弹出内容和弹出框大小设置
        ss=''
        for i in range(len(s)):
            ss = ss + s[i] + '</br>'
        pop = folium.Popup(html=ss,max_width=WIDTH*10)
        icon = CustomIcon(icon_image ='loc.jpg',icon_size=(20, 20))
        # tooltip:悬浮弹出信息;popup:点击出现信息
        folium.Marker([latitude,longitude],icon=icon, popup=pop,tooltip=parse_zhch(tip)).add_to(m)

    m.save('map.html')
    wb.open('map.html')


if __name__ == '__main__':

    df_data,df_policy = get_data()
    show_map(df_data,df_policy)
实现效果:
到此这篇关于python用folium绘制地图并设置弹窗效果的文章就介绍到这了,更多相关python folium绘制地图内容请搜索自学编程网以前的文章或继续浏览下面的相关文章希望大家以后多多支持自学编程网!

- 本文固定链接: https://zxbcw.cn/post/221569/
- 转载请注明:必须在正文中标注并保留原文链接
- QQ群: PHP高手阵营官方总群(344148542)
- QQ群: Yii2.0开发(304864863)