
2020
09-29
09-29
pyecharts调整图例与各板块的位置间距实例
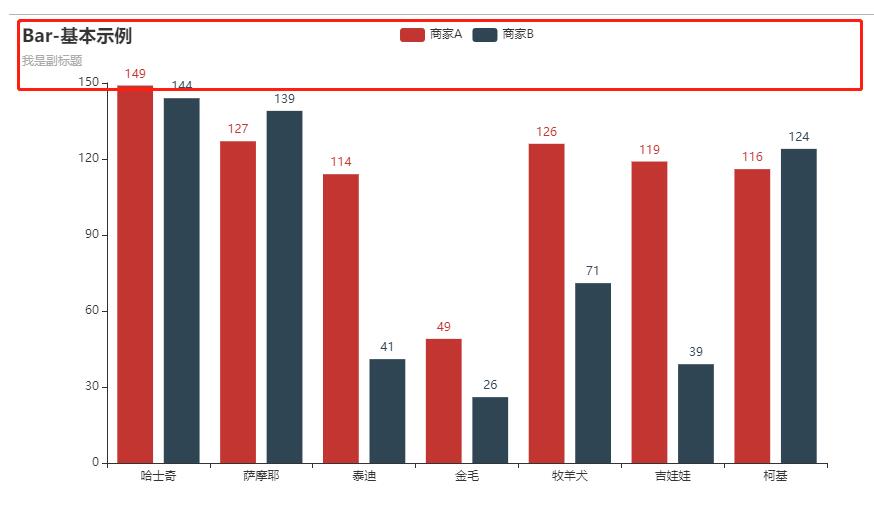 引入Gridgrid=Grid()#可以分别调整上下左右的位置,可以是百分比,也可以是具体像素,如pos_top="50px"grid.add(c,grid_opts=opts.GridOpts(pos_top="50%",pos_bottom="50%",pos_left="50%",pos_right="50%"))调整前的默认距离代码如下fromexample.commonsimportFakerfrompyechartsimportoptionsasoptsfrompyecharts.chartsimportBar,Griddefbar_base()->Bar:c=(Bar().add_xaxis(Faker.choose()).add_yaxis...
继续阅读 >
引入Gridgrid=Grid()#可以分别调整上下左右的位置,可以是百分比,也可以是具体像素,如pos_top="50px"grid.add(c,grid_opts=opts.GridOpts(pos_top="50%",pos_bottom="50%",pos_left="50%",pos_right="50%"))调整前的默认距离代码如下fromexample.commonsimportFakerfrompyechartsimportoptionsasoptsfrompyecharts.chartsimportBar,Griddefbar_base()->Bar:c=(Bar().add_xaxis(Faker.choose()).add_yaxis...
继续阅读 >
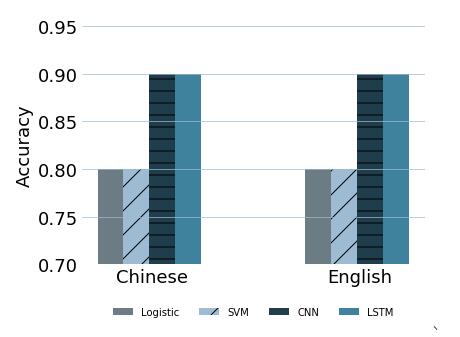 我就废话不多说了,还是直接看代码吧!#-*-coding:utf-8-*-"""CreatedonWedMar713:10:212018@author:su"""importnumpyasnpimportmatplotlib.pyplotaspltn_groups=2num_list=[0.8,0.80]num_list1=[0.8,0.8]num_list2=[0.9,0.9]num_list3=[0.9,0.9]fig,ax=plt.subplots()plt.grid(True,linestyle="-",color="#9dbcd4",linewidth="0.7",axis='y')ax=plt.gca()ax.spines['top'].s...
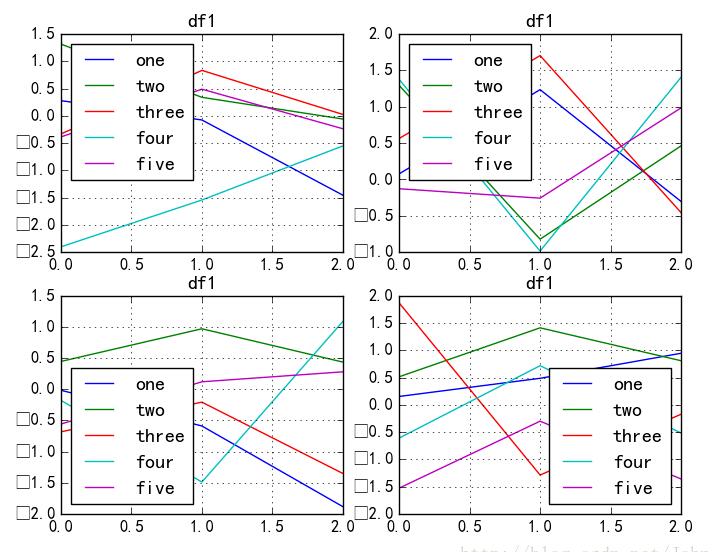 关于matplotlib如何设置图例的位置?如何将图例放在图外?以及如何在一幅图有多个子图的情况下,删除重复的图例?我用一个简单的例子说明一下。importpandasaspdimportnumpyasnpimportmatplotlib.pyplotaspltfig=plt.figure(1)ax1=fig.add_subplot(2,2,1)ax2=fig.add_subplot(2,2,2)ax3=fig.add_subplot(2,2,3)ax4=fig.add_subplot(2,2,4)df1=pd.DataFrame(np.random.randn(3,5),columns=['one','two','thr...