分类:数据
 前言本文的文字及图片来源于网络,仅供学习、交流使用,不具有任何商业用途,版权归原作者所有,如有问题请及时联系我们以作处理。frommathimportpiimportmatplotlib.pyplotaspltcat=['Speed','Reliability','Comfort','Safety','Effieciency']values=[90,60,65,70,40]N=len(cat)x_as=[n/float(N)*2*piforninrange(N)]ax=plt.subplot(111)plt.xticks(x_as)ax.plot(x_as,values,linewidth=1,...
继续阅读 >
python画分布图代码示例:#encoding=utf-8importmatplotlib.pyplotaspltfrompylabimport*#支持中文mpl.rcParams['font.sans-serif']=['SimHei']#'mentioned0cluster',names=['mentioned1cluster','mentioned2cluster','mentioned3cluster','mentioned4cluster','mentioned5cluster','mentioned6cluster','mentioned7cluster','mentioned8cluster','mentioned9cluster','mentioned10cluster']x=range(len(...
继续阅读 >
2020
10-01
 场景:项目有两种角色需要不同的登录权限,将redis做为用户登录信息缓存数据库。码一个方法,希望能够根据传入不用用户实体类型来获取相应的数据。用户实体为:SessionEntity<User1>、SessionEntity<User2>。json使用FastJson。先阐述遇到的几个问题:1、redis获取到的数据序列化后,转json,经常提示转换异常(并不是每次,只是时常)。2、不想每种用户都书写一个redis操作方法(显得tailow)。解决:1、redis获取到的数据序列化...
继续阅读 >

 前言本文的文字及图片来源于网络,仅供学习、交流使用,不具有任何商业用途,版权归原作者所有,如有问题请及时联系我们以作处理。frommathimportpiimportmatplotlib.pyplotaspltcat=['Speed','Reliability','Comfort','Safety','Effieciency']values=[90,60,65,70,40]N=len(cat)x_as=[n/float(N)*2*piforninrange(N)]ax=plt.subplot(111)plt.xticks(x_as)ax.plot(x_as,values,linewidth=1,...
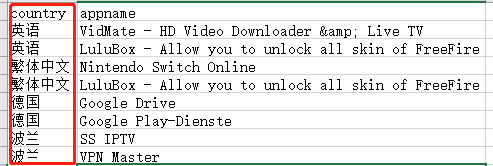
 需求:根据country列的不同值,将内容分到不同sheet方法一:读取原Excel,根据country列将不同的内容放到不同的sheet,并根据国家名称命名,将结果放到新的输出文件中。#!/usr/bin/envpython3#读取Excel文件importpandasaspdinput_file="F://python入门//数据2//appname_test.xlsx"output_file="F://python入门//数据2//output.xlsx"data_frame=pd.read_excel(input_file,sheet_name='sum1',index_col=None)data_frame...
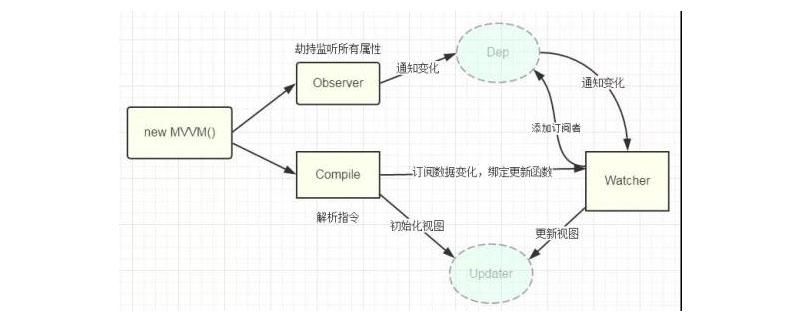
 Vue数据双向绑定原理是通过数据劫持结合发布者-订阅者模式的方式来实现的,首先是对数据进行监听,然后当监听的属性发生变化时则告诉订阅者是否要更新,若更新就会执行对应的更新函数从而更新视图MVC模式以往的MVC模式是单向绑定,即Model绑定到View,当我们用JavaScript代码更新Model时,View就会自动更新MVVM模式MVVM模式就是Model?View?ViewModel模式。它实现了View的变动,自动反映在ViewModel,反之亦然。对于双向绑定的理解...