
2021
04-07
04-07
用R语言绘制ROC曲线的实例讲解
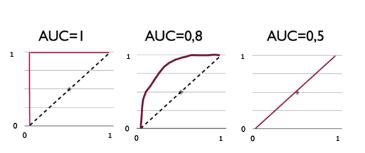 1roc曲线的意义ROC曲线就是用来判断诊断的正确性,最理想的就是曲线下的面积为1,比较理想的状态就是曲线下的面积在0.8-0.9之间,0.5的话对实验结果没有什么影响。如图:2代码部分install.packages(“pROC”)install.packages(“ggplot2”)library(pROC)library(ggplot2)#建立曲线data(aSAH)rocobj1<-roc(aSAHoutcome,aSAHoutcome,aSAHoutcome,aSAHs100b)rocobj2<-roc(aSAHoutcome,aSAHoutcome,aSAHoutco...
继续阅读 >
1roc曲线的意义ROC曲线就是用来判断诊断的正确性,最理想的就是曲线下的面积为1,比较理想的状态就是曲线下的面积在0.8-0.9之间,0.5的话对实验结果没有什么影响。如图:2代码部分install.packages(“pROC”)install.packages(“ggplot2”)library(pROC)library(ggplot2)#建立曲线data(aSAH)rocobj1<-roc(aSAHoutcome,aSAHoutcome,aSAHoutcome,aSAHs100b)rocobj2<-roc(aSAHoutcome,aSAHoutcome,aSAHoutco...
继续阅读 >