分类:Matplotlib
示例代码如下:#!/usr/bin/python#-*-coding:utf-8-*-importmatplotlib.pyplotasplt#figsize-图像尺寸(figsize=(10,10))#facecolor-背景色(facecolor="blue")#dpi-分辨率(dpi=72)fig=plt.figure(figsize=(10,10),facecolor="blue")#figsize默认为4,4(图像尺寸)ax1=fig.add_subplot(1,1,1)#行列位置#ax2=fig.add_subplot(2,1,2)#ax=fig.add_subplot(1,1,1)ax1.set_title("title")#不支持中文#...
继续阅读 >
2020
10-10
2020
10-10
2020
10-10
2020
10-09
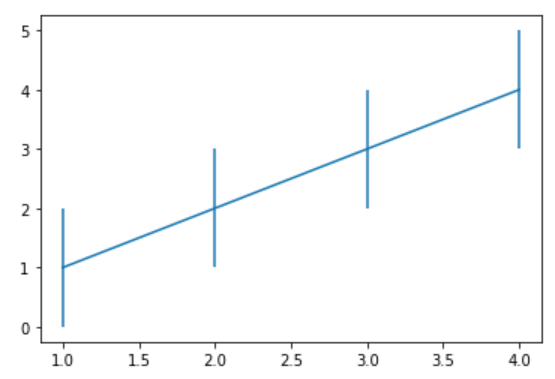 在matplotlib中,errorbar方法用于绘制带误差线的折线图,基本用法如下plt.errorbar(x=[1,2,3,4],y=[1,2,3,4],yerr=1)输出结果如下yerr参数用于指定y轴水平的误差,同时该方法也支持x轴水平的误差,对应参数xerr。指定误差值有多种方式,上述代码展示的是指定一个统一标量的用法,此时,所以的点误差值都一样。除此之外,还可以指定为一个和点的个数相同的数组,为每个点单独设置误差值,用法如下plt.errorbar(x=[1,2,3,...
继续阅读 >
2020
10-08
2020
10-08

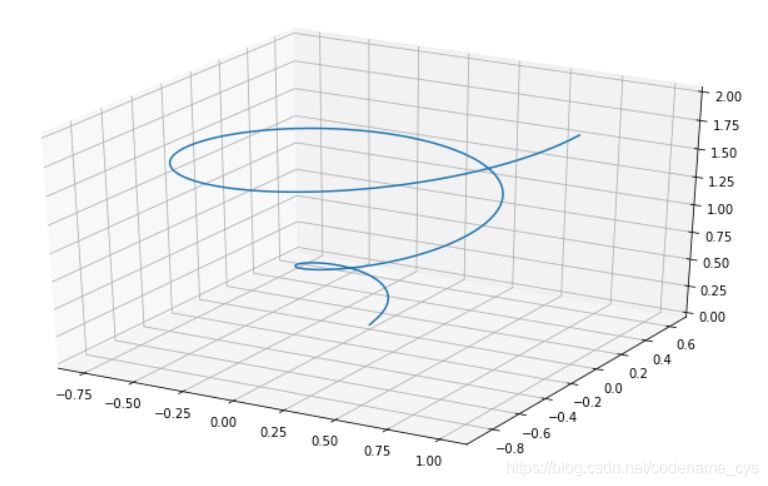 1.python三维图表绘制方法简介python三维图表的绘制算是二维图表的一个进阶版本,本质上和二维图表的绘制并无差别,唯一的区别在于使用的库略有差异。相较于二维图表使用的pyplot库,三维图表的绘制使用的是Axes3D库。库引入语句为:frommatplotlibimportpyplotaspltfrommpl_toolkits.mplot3dimportAxes3D上下的操作就和二维图表绘制大差不差了,首先定义三维画布,然后向里面绘制三维图表,最后打印出结果即可。下面,我...
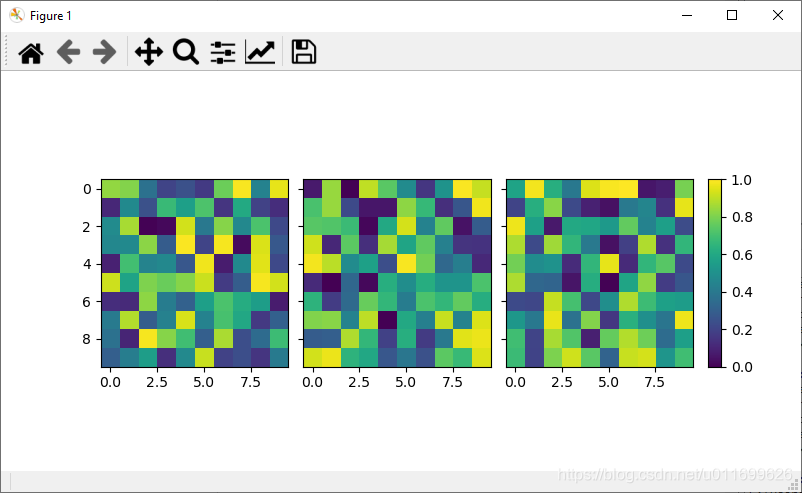 本文主要介绍了matplotlib多个图像共用一个colorbar的实现示例,分享给大家,具体如下:#-*-coding:utf-8-*-"""CreatedonSatSep518:05:112020@author:15025drawthreefigureswithonecommoncolorbar"""importnumpyasnpimportmatplotlib.pyplotaspltfrommpl_toolkits.axes_grid1importImageGridclassVisualazation:defmainProgram(self):#Setupfigureandimagegridfig=plt.figure(figs...
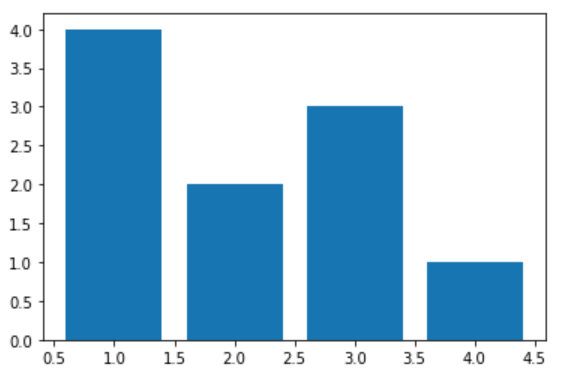 在matplotlib中,bar命令用于绘制柱状图,基本用法如下在matplotlib中,bar命令用于绘制柱状图,基本用法如下在matplotlib中,bar命令用于绘制柱状图,基本用法如下在matplotlib中,bar命令用于绘制柱状图,基本用法如下在matplotlib中,bar命令用于绘制柱状图,基本用法如下在matplotlib中,bar命令用于绘制柱状图,基本用法如下plt.bar(x=[1,2,3,4],height=[4,2,3,1])输出结果如下参数x的值作为x轴坐标,height的值作...
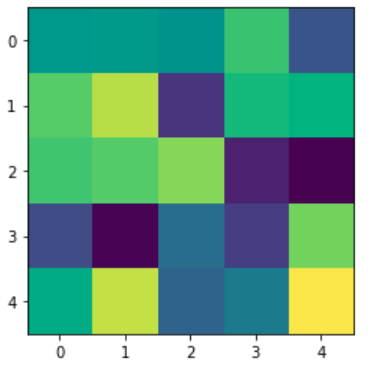 在matplotlib中,imshow方法用于绘制热图,基本用法如下importmatplotlib.pyplotaspltimportnumpyasnpnp.random.seed(123456789)data=np.random.rand(25).reshape(5,5)plt.imshow(data)输出结果如下imshow方法首先将二维数组的值标准化为0到1之间的值,然后根据指定的渐变色依次赋予每个单元格对应的颜色,就形成了热图。对于热图而言,通常我们还需要画出对应的图例,图例通过colorbar方法来实现,代码如下plt.imshow(da...
 在matplotlib中,errorbar方法用于绘制带误差线的折线图,基本用法如下plt.errorbar(x=[1,2,3,4],y=[1,2,3,4],yerr=1)输出结果如下yerr参数用于指定y轴水平的误差,同时该方法也支持x轴水平的误差,对应参数xerr。指定误差值有多种方式,上述代码展示的是指定一个统一标量的用法,此时,所以的点误差值都一样。除此之外,还可以指定为一个和点的个数相同的数组,为每个点单独设置误差值,用法如下plt.errorbar(x=[1,2,3,...
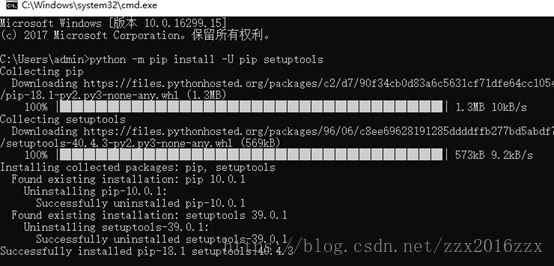 在网上看见许多matplotlib的安装教程都是比较复杂,需要配置许多环境,对于电脑基础不好的人来说可是一件头疼的事情,今天我介绍一个简单的安装方法。1.Win+R输入cmd进入到CMD窗口下,执行python-mpipinstall-Upipsetuptools进行升级。2.输入python-mpipinstallmatplotlib进行自动的安装,系统会自动下载安装包3.进入到pythonidle中,运行importmatplotlib,如下图所示,如果没有报错,就证明安装成果。输入以下代码运...
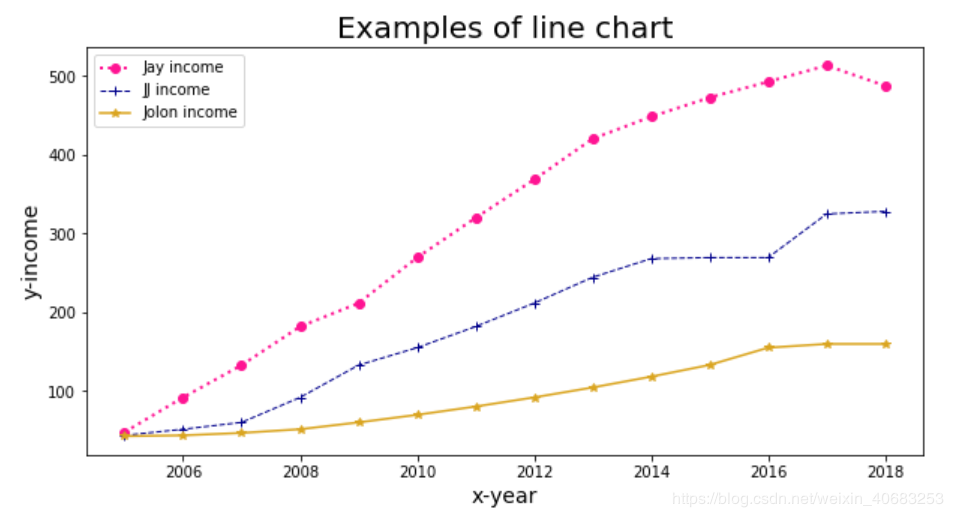 散点图和折线图是数据分析中最常用的两种图形。其中,折线图用于分析自变量和因变量之间的趋势关系,最适合用于显示随着时间而变化的连续数据,同时还可以看出数量的差异,增长情况。Matplotlib中绘制散点图的函数为plot(),使用语法如下:matplotlib.pyplot.plot(*args, scalex=True, scaley=True, data=None, **kwargs)常用参数及说明:参数接收值说明默认值...