
2020
10-08
10-08
matplotlib图例legend语法及设置的方法
1.图例legend基础语法及用法legend语法参数如下:matplotlib.pyplot.legend(*args, **kwargs)KeywordDescriptionlocLocationcodestring,ortuple(seebelow).图例所有figure位置propthefontproperty字体参数fontsizethefontsize(usedonlyifpropisnotspecified)markerscaletherelativesizeoflegendma...
继续阅读 >
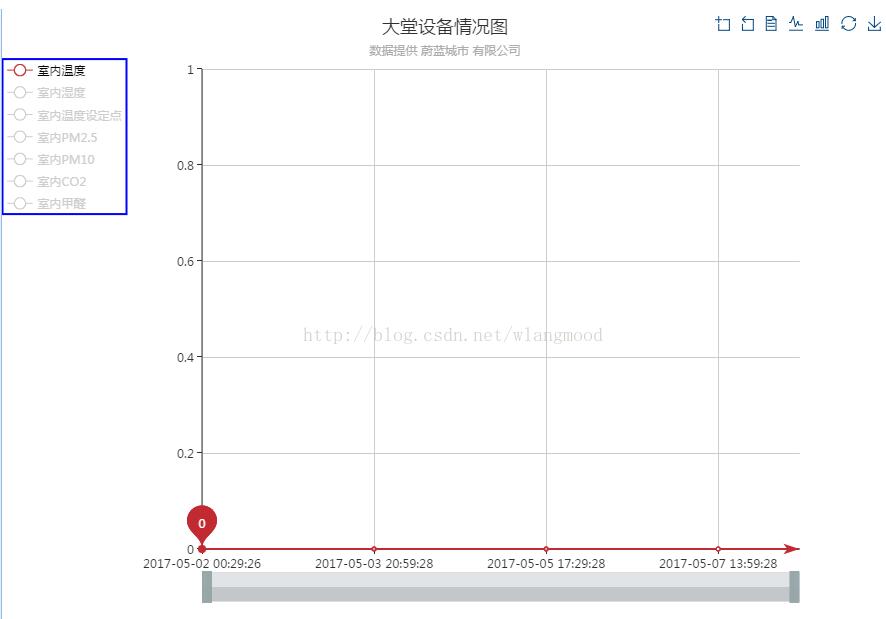 1、效果图2、实现方法将图例legend纵向排列(orient:'vertical'),宽度给150(width:150),坐标系grid左侧距离200(left:200),中间有50的边距3、代码展示grid:{left:200},legend:{x:'left',data:['送风温度','混风温度','冷冻水送水温度','冷冻水回水温度','热水送水温度','热水回水温度','送风温度设定点','风机速度','风机速度反馈','风阀开度'],inactiveColor:'#999',selectedMode:'single',o...
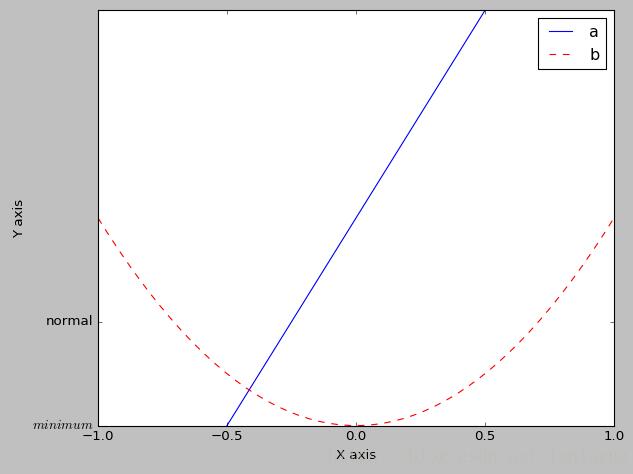 在使用matplotlib画图时,少不了对性能图形做出一些说明和补充。一般情况下,loc属性设置为'best'就足够应付了plt.legend(handles=[l1,l2,],labels=['a','b'],loc='best')或直接loc=0plt.legend(handles=[l1,l2,],labels=['a','b'],loc=0)除'best',另外loc属性有:'upperright','upperleft','lowerleft','lowerright','right','centerleft','centerright','lowercenter','uppercenter','c...
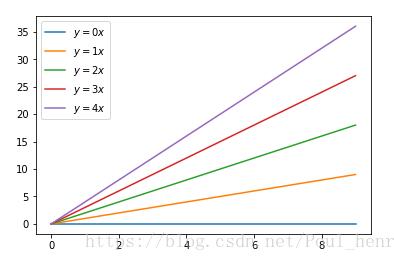 用python的matplotlib画图时,往往需要加图例说明。如果不设置任何参数,默认是加到图像的内侧的最佳位置。importmatplotlib.pyplotaspltimportnumpyasnpx=np.arange(10)fig=plt.figure()ax=plt.subplot(111)foriinxrange(5):ax.plot(x,i*x,label='$y=%ix$'%i)plt.legend()plt.show()这样的结果如图所示:如果需要将该legend移到图像外侧,有多种方法,这里介绍一种。在plt.legend()函数中加入若干参...