
1、定义一个画圆的函数
import numpy as np
import matplotlib.pyplot as plt

def plot_circle(center=(3, 3),r=2):
  x = np.linspace(center[0] - r, center[0] + r, 5000)
  y1 = np.sqrt(r**2 - (x-center[0])**2) + center[1]
  y2 = -np.sqrt(r**2 - (x-center[0])**2) + center[1]

  plt.plot(x, y1, c='k')
  plt.plot(x, y2, c='k')
  plt.show()
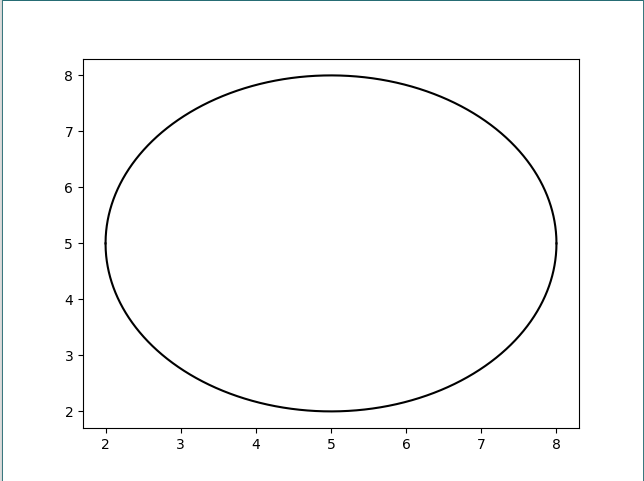
2、调用 plot_circle()
plot_circle((5, 5), r=3)
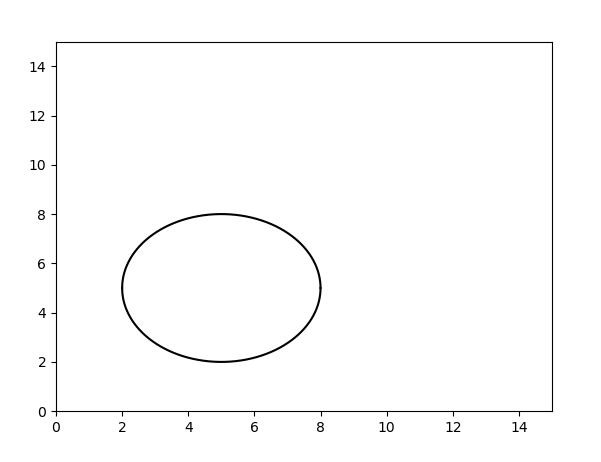
调整坐标轴,重新绘图
import matplotlib.pyplot as plt
plt.xlim(0, 15)
plt.ylim(0, 15)
plot_circle((5, 5),r=3)
只要将步骤 1 函数定义的复杂一些,还可以实现很多玩法。
以上就是本文的全部内容,希望对大家的学习有所帮助,也希望大家多多支持自学编程网。

- 本文固定链接: https://zxbcw.cn/post/187448/
- 转载请注明:必须在正文中标注并保留原文链接
- QQ群: PHP高手阵营官方总群(344148542)
- QQ群: Yii2.0开发(304864863)