
这是一个绘制矩阵的函数。
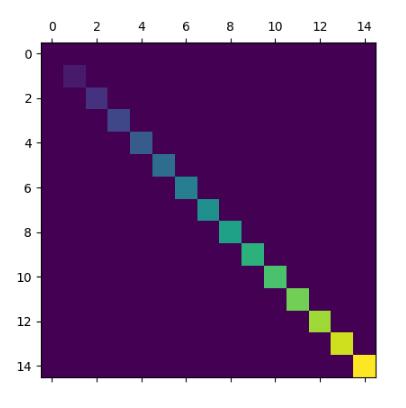
用matshow绘制矩阵的例子:
import matplotlib.pyplot as plt
import numpy as np

def samplemat(dims):
 """Make a matrix with all zeros and increasing elements on the diagonal"""
 aa = np.zeros(dims)
 for i in range(min(dims)):
  aa[i, i] = i
 return aa

# Display matrix
plt.matshow(samplemat((15, 15)))

plt.show()
效果图:
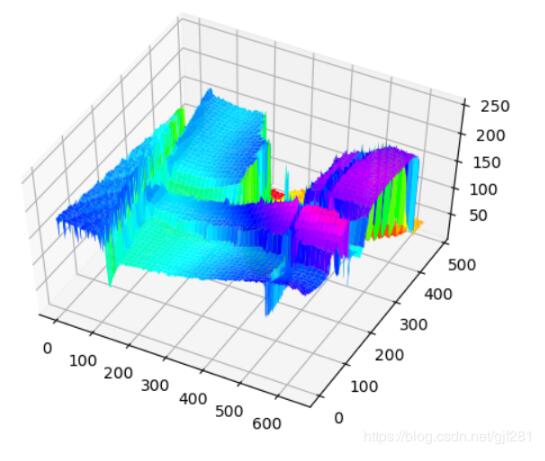
补充知识:利用matplotlib将矩阵画成三维图
import cv2 as cv
import numpy as np
import matplotlib.pyplot as plt
from matplotlib import cm
from mpl_toolkits import mplot3d

cap = cv.VideoCapture(0)
cpframe = None
while True:
 ret, frame = cap.read()
 cv.imshow("video", frame)
 if cv.waitKey(1) & 0xFF ==ord('q'):
  cpframe = frame
  break

img_gray = cv.cvtColor(cpframe, cv.COLOR_RGB2GRAY)

Y = np.arange(0, np.shape(img_gray)[0], 1)
X = np.arange(0, np.shape(img_gray)[1], 1)
X, Y = np.meshgrid(X, Y)
fig = plt.figure()
ax = plt.axes(projection="3d")
ax.plot_surface(X, Y, img_gray, cmap=cm.gist_rainbow)
plt.show()
以上这篇matplotlib.pyplot.matshow 矩阵可视化实例就是小编分享给大家的全部内容了,希望能给大家一个参考,也希望大家多多支持自学编程网。

- 本文固定链接: https://zxbcw.cn/post/188731/
- 转载请注明:必须在正文中标注并保留原文链接
- QQ群: PHP高手阵营官方总群(344148542)
- QQ群: Yii2.0开发(304864863)