
在教材实例编写雷达图时出现ValueError,具体如下:
ValueError: The number of FixedLocator locations (7), usually from a call to set_ticks, does not match the number of ticklabels (6).
而原代码如下:
import numpy as np
import matplotlib.pyplot as plt
import matplotlib
matplotlib.rcParams['font.family']='SimHei'
matplotlib.rcParams['font.sans-serif'] = ['SimHei']
labels = np.array(['综合','KDA','发育','推进','生存','输出'])
nAttr = 6
data = np.array([7,5,6,9,8,7])
angles = np.linspace(0,2*np.pi,nAttr,endpoint=False)
data = np.concatenate((data,[data[0]]))
angles = np.concatenate((angles,[angles[0]]))
fig = plt.figure(facecolor="white")
plt.subplot(111,polar=True)
plt.plot(angles,data,'bo-',color ='g',linewidth=2)
plt.fill(angles,data,facecolor='g',alpha=0.25)
plt.thetagrids(angles*180/np.pi,labels)
plt.figtext(0.52,0.95,'DOTA能力值雷达图',ha='center')
plt.grid(True)
plt.show()
原因在于对array类型data、angles进行封闭时,未对labels进行相同操作,导致labels内元素个数与前两者不相同,从而出现ValueError。
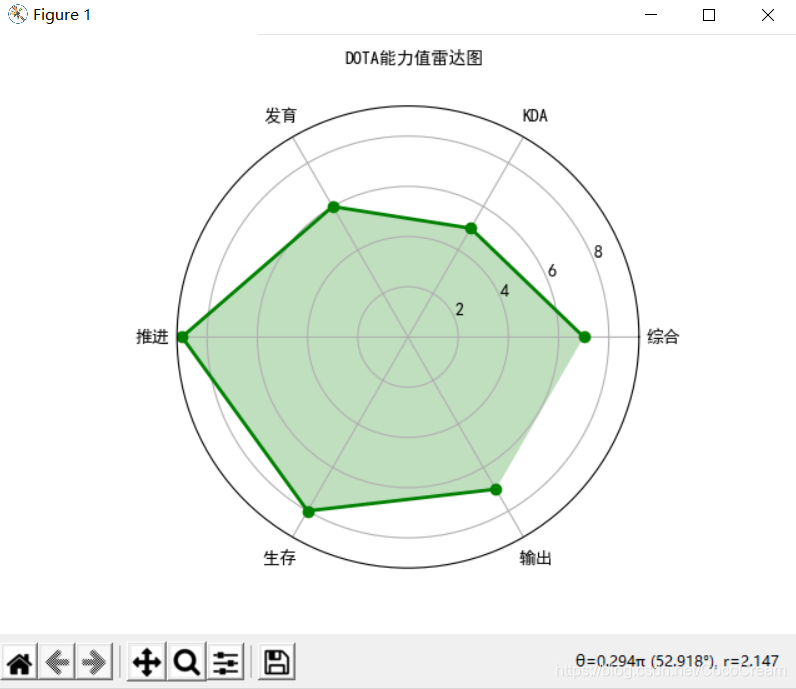
之前在网上寻找解决方案,发现大多数答主选着将对data、angles进行封闭的语句注释掉,但这样就会导致雷达图不完整,缺少一条连线:
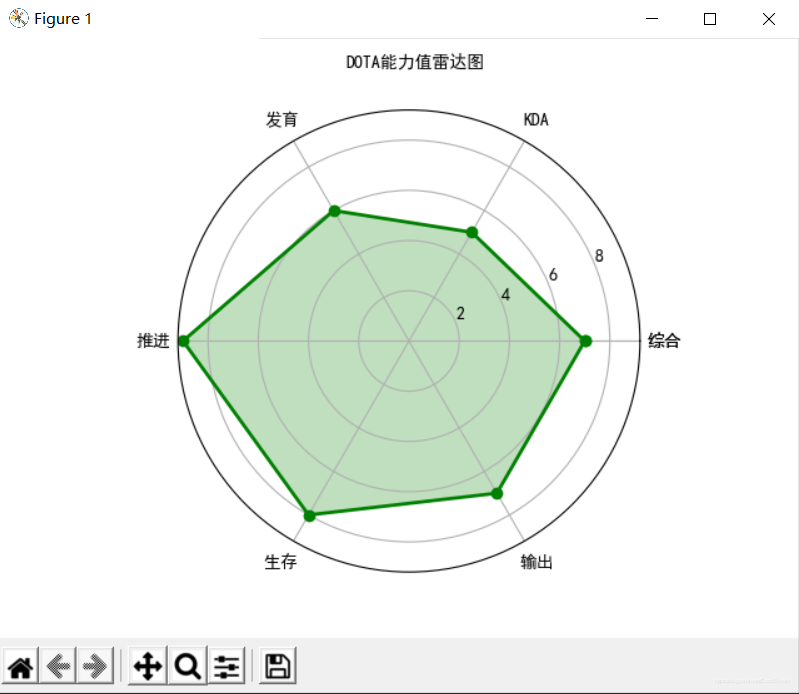
而只需对labels同样进行封闭即可:
data = np.concatenate((data,[data[0]]))
angles = np.concatenate((angles,[angles[0]]))
labels=np.concatenate((labels,[labels[0]]))  #对labels进行封闭
最终运行结果
到此这篇关于matplotlib制作雷达图报错ValueError的实现的文章就介绍到这了,更多相关matplotlib 雷达图报错 内容请搜索自学编程网以前的文章或继续浏览下面的相关文章希望大家以后多多支持自学编程网!

- 本文固定链接: https://zxbcw.cn/post/203477/
- 转载请注明:必须在正文中标注并保留原文链接
- QQ群: PHP高手阵营官方总群(344148542)
- QQ群: Yii2.0开发(304864863)