
springboot2.x暴露健康状况通过prometheus监控
加入依赖
 <!--prometheus监控 https://prometheus.io/docs/introduction/overview/-->
 <dependency>
 <groupId>org.springframework.boot</groupId>
 <artifactId>spring-boot-starter-actuator</artifactId>
 </dependency>
 <dependency>
 <groupId>io.micrometer</groupId>
 <artifactId>micrometer-registry-prometheus</artifactId>
 </dependency>
 <!--prometheus监控 https://prometheus.io/docs/introduction/overview/-->
application.yml加入相关配置
management:
 security:
 enabled: false
 #prometheus+grafana+springboot2监控集成配置
 metrics:
 export:
 prometheus:
 enabled: true
 jmx:
 enabled: true
 endpoints:
 web:
 exposure:
 include: '*'
 base-path: /metrics
 #prometheus+grafana+springboot2监控集成配置
主启动类加入配置
package com.drore.saas;
import com.drore.saas.services.service.StorageService;
import io.micrometer.core.instrument.MeterRegistry;
import org.springframework.boot.CommandLineRunner;
import org.springframework.boot.SpringApplication;
import org.springframework.boot.actuate.autoconfigure.metrics.MeterRegistryCustomizer;
import org.springframework.boot.autoconfigure.SpringBootApplication;
import org.springframework.boot.web.servlet.ServletComponentScan;
import org.springframework.context.annotation.Bean;
@SpringBootApplication
@ServletComponentScan
public class TenantappApplication {
 public static void main(String[] args) {
 SpringApplication.run(TenantappApplication.class, args);
 }
 @Bean
 CommandLineRunner init(StorageService storageService) {
 return (args) -> {
 storageService.init();
 };
 }
#prometheus+grafana+springboot2监控集成配置
 @Bean
 MeterRegistryCustomizer meterRegistryCustomizer(MeterRegistry meterRegistry) {
 return meterRegistry1 -> {
 meterRegistry.config()
 .commonTags("application", "Tenantapp");
 };
 }
 #prometheus+grafana+springboot2监控集成配置
}
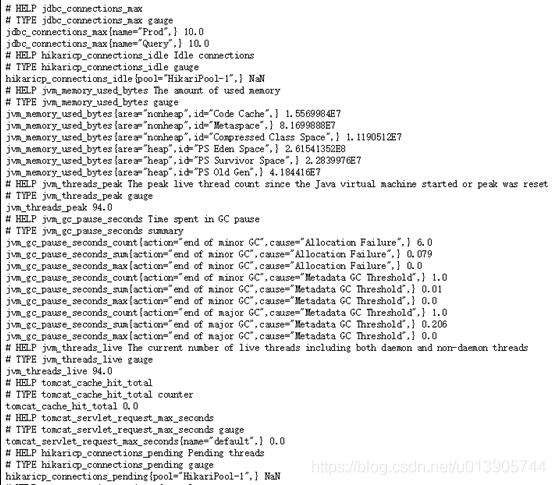
启动之后通过路径访问查看健康状况
http://xxxxxx/metrics/prometheus
查看到的数据如下:
[root@saas98 /]$ curl "http://10.98.94.220:80/ts/metrics/prometheus"
# HELP process_start_time_seconds Start time of the process since unix epoch.
# TYPE process_start_time_seconds gauge
process_start_time_seconds{application="Tenantapp",} 1.556068841226E9
# HELP tomcat_threads_busy_threads
# TYPE tomcat_threads_busy_threads gauge
tomcat_threads_busy_threads{application="Tenantapp",name="http-nio-9081",} 1.0
# HELP tomcat_sessions_expired_sessions_total
# TYPE tomcat_sessions_expired_sessions_total counter
tomcat_sessions_expired_sessions_total{application="Tenantapp",} 0.0
# HELP tomcat_sessions_active_current_sessions
# TYPE tomcat_sessions_active_current_sessions gauge
tomcat_sessions_active_current_sessions{application="Tenantapp",} 0.0
# HELP jvm_gc_memory_promoted_bytes_total Count of positive increases in the size of the old generation memory pool before GC to after GC
# TYPE jvm_gc_memory_promoted_bytes_total counter
jvm_gc_memory_promoted_bytes_total{application="Tenantapp",} 1.18894656E8
# HELP tomcat_global_request_max_seconds
# TYPE tomcat_global_request_max_seconds gauge
tomcat_global_request_max_seconds{application="Tenantapp",name="http-nio-9081",} 3.366
# HELP jvm_memory_used_bytes The amount of used memory
# TYPE jvm_memory_used_bytes gauge
jvm_memory_used_bytes{application="Tenantapp",area="heap",id="Survivor Space",} 653880.0
jvm_memory_used_bytes{application="Tenantapp",area="nonheap",id="Metaspace",} 1.36445248E8
jvm_memory_used_bytes{application="Tenantapp",area="heap",id="Eden Space",} 7511504.0
jvm_memory_used_bytes{application="Tenantapp",area="nonheap",id="Code Cache",} 3.8031424E7
jvm_memory_used_bytes{application="Tenantapp",area="heap",id="Tenured Gen",} 1.3880212E8
jvm_memory_used_bytes{application="Tenantapp",area="nonheap",id="Compressed Class Space",} 1.7220968E7
# HELP tomcat_sessions_created_sessions_total
# TYPE tomcat_sessions_created_sessions_total counter
tomcat_sessions_created_sessions_total{application="Tenantapp",} 0.0
# HELP system_cpu_count The number of processors available to the Java virtual machine
# TYPE system_cpu_count gauge
system_cpu_count{application="Tenantapp",} 1.0
# HELP tomcat_global_sent_bytes_total
# TYPE tomcat_global_sent_bytes_total counter
tomcat_global_sent_bytes_total{application="Tenantapp",name="http-nio-9081",} 8168269.0
# HELP jvm_threads_daemon_threads The current number of live daemon threads
# TYPE jvm_threads_daemon_threads gauge
jvm_threads_daemon_threads{application="Tenantapp",} 34.0
# HELP logback_events_total Number of error level events that made it to the logs
# TYPE logback_events_total counter
logback_events_total{application="Tenantapp",level="debug",} 0.0
logback_events_total{application="Tenantapp",level="error",} 965.0
logback_events_total{application="Tenantapp",level="warn",} 4.0
logback_events_total{application="Tenantapp",level="info",} 1047.0
logback_events_total{application="Tenantapp",level="trace",} 0.0
# HELP tomcat_cache_access_total
# TYPE tomcat_cache_access_total counter
tomcat_cache_access_total{application="Tenantapp",} 0.0
# HELP tomcat_servlet_error_total
# TYPE tomcat_servlet_error_total counter
tomcat_servlet_error_total{application="Tenantapp",name="dispatcherServlet",} 0.0
tomcat_servlet_error_total{application="Tenantapp",name="statViewServlet",} 0.0
tomcat_servlet_error_total{application="Tenantapp",name="default",} 0.0
# HELP jvm_buffer_total_capacity_bytes An estimate of the total capacity of the buffers in this pool
prometheus-operator监控java应用整合
目前的prometheus-operator目录下的相关文件
https://github.com/coreos/prometheus-operator.git
已经移植到
https://github.com/coreos/kube-prometheus.git
具体原因参照官网。
下面也有自己总结的文档的地址,大家可以参照下:
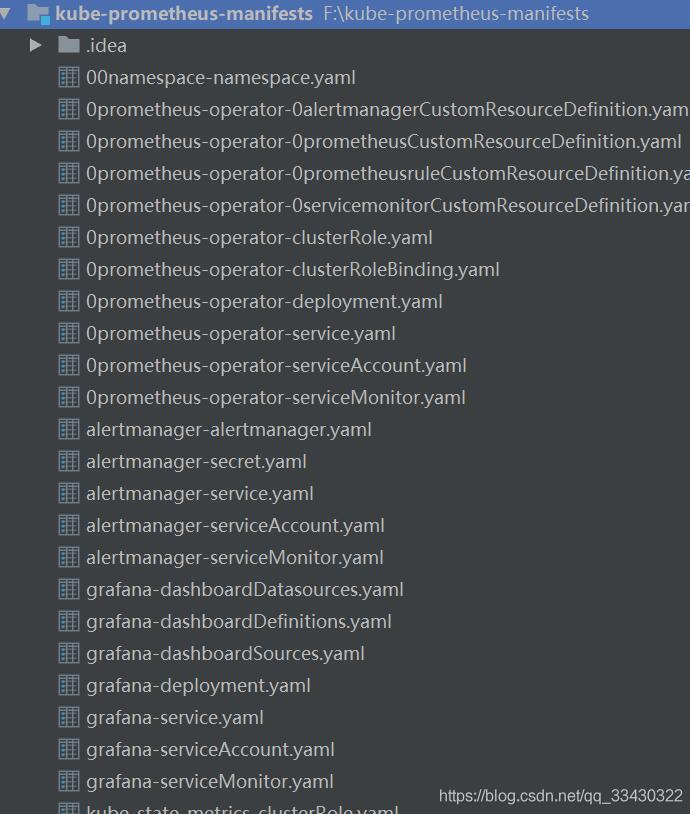
https://github.com/hkj123/kube-prometheus-manifests.git
具体的文件如下图展示,这里有很多文件,我们只介绍关注的几个文件,其他的可以参照官网了解:
构建springboot项目的时候需要注意的点:
---
kind: Service
apiVersion: v1
metadata:
 labels:
 app: ms #prometheus配置监控需要通过app去监控,这个k8s-app和app都可以
 namespace: drore-saas
 name: ms
spec:
 ports:
 - name: http-ms #prometheus配置监控需要通过port name去识别,当然也可以直接配置端口,不过这样看起来更专业
 nodePort: 31945
 protocol: TCP
 port: 80
 targetPort: 80
 selector:
 app: ms
 type: NodePort
---
部署prometheus需要注意的点
https://github.com/coreos/kube-prometheus/manifests
提供了一套整合的例子:
需要修改的文件: prometheus-clusterRole.yaml
默认的文件内容:
apiVersion: rbac.authorization.k8s.io/v1
kind: ClusterRole
metadata:
 name: prometheus-k8s
rules:
- apiGroups:
 - ""
 resources:
 - nodes/metrics
 verbs:
 - get
- nonResourceURLs:
 - /metrics
 verbs:
 - get
可以发现这里的监控的resources:- nodes/metrics
我们需要监控自己构建的java应用需要扩大权限
apiVersion: rbac.authorization.k8s.io/v1
kind: ClusterRole
metadata:
 name: prometheus-k8s
rules:
- apiGroups:
 - ""
 resources:
 - nodes
 - services
 - endpoints
 - pods
 - nodes/proxy
 verbs:
 - get
 - list
 - watch
- apiGroups:
 - ""
 resources:
 - configmaps
 - nodes/metrics
 verbs:
 - get
- nonResourceURLs:
 - /metrics
 verbs:
 - get
书写monitor监控文件,提供了一下参考的文件:prometheus-serviceMonitor.yaml
自己编写的 :prometheus-serviceMonitorSelfServiceMs.yaml
apiVersion: monitoring.coreos.com/v1
kind: ServiceMonitor
metadata:
 name: drore-saas-ms
 namespace: monitoring
spec:
 endpoints:
 - interval: 15s
 port: http-ms #prometheus配置注意这个port的名称
 path: /ms/metrics/prometheus #prometheus配置注意这个路径
 jobLabel: app #prometheus配置注意我们用的是app在springboot构建的时候
 namespaceSelector: # 表示去匹配某一命名空间中的service,如果想从所有的namespace中匹配用any: true
 matchNames:
 - drore-saas
 selector:
 matchLabels:
 app: ms #prometheus配置注意我们用的是app在springboot构建的时候
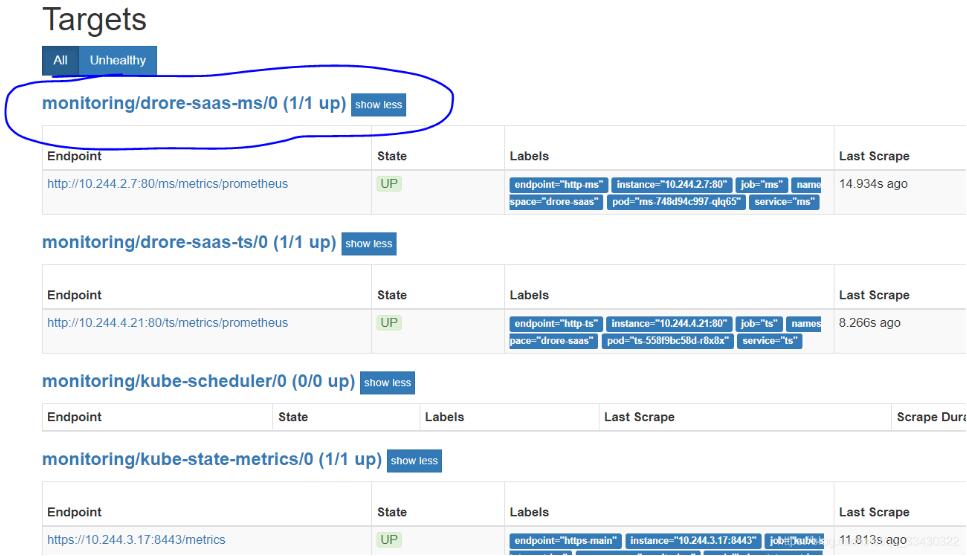
配置完毕之后使用
kubectl apply -f prometheus-clusterRole.yaml -f prometheus-serviceMonitorSelfServiceMs.yaml
就可以登录管理界面去看了
http://118.31.17.205:31144/targets
报警规则可以通过 prometheus-rules.yaml 去配置
参考
https://github.com/coreos/prometheus-operator
补充:spring boot2.x暴露监控endpoint并配置prometheus及grafana对多个targets进行监控
1. build.gradle中添加依赖
compile group: 'org.springframework.boot', name: 'spring-boot-starter-actuator'
compile group: 'org.springframework.boot', name: 'spring-boot-starter-security'
compile('io.micrometer:micrometer-registry-prometheus')
2. spring boot 2.x暴露信息
不同于之前的Actuator 1.x,Actuator 2.x 的大多数端点默认被禁掉。 Actuator 2.x 中的默认端点增加了/actuator前缀。
3. spring boot服务端改造
配置信息
server.port=8085
management.endpoints.web.exposure.include=prometheus
management.endpoint.metrics.enabled=true
spring.security.user.name=xxx
spring.security.user.password=123456
spring.security.user.roles=ACTUATOR_ADMIN
management.server.port=8090
management.endpoints.web.base-path=/admin
指定权限
@Configuration
public class ActuatorSecurityConfig extends WebSecurityConfigurerAdapter {
 @Override
 protected void configure(HttpSecurity http) throws Exception {
 http.requestMatcher(EndpointRequest.toAnyEndpoint()).authorizeRequests().antMatchers("/actuator/*").hasRole(
 "ACTUATOR_ADMIN").and().httpBasic();
 }
}
这样我们可以看到:
这个spring boot服务启动了两个端口:
8085端口,进行正常的业务处理
8090端口,admin,暴露出监控信息,并通过spring security进行权限控制
打开浏览器访问http://192.168.211.2:8090/admin/prometheus
输入用户名 密码
4. Prometheus监控多个spring boot服务
下载prometheus-2.11.1.linux-amd64.tar.gz
编写配置文件prometheus.yml
global:
 scrape_interval: 10s
 scrape_timeout: 10s
 evaluation_interval: 10m
scrape_configs:
 - job_name: app-gateway
 scrape_interval: 5s
 scrape_timeout: 5s
 metrics_path: /admin/prometheus
 scheme: http
 basic_auth:
 username: root
 password: 1230456
 static_configs:
 - targets:
 - 192.168.211.2:8099
 - job_name: search
 scrape_interval: 5s
 scrape_timeout: 5s
 metrics_path: /admin/prometheus
 scheme: http
 basic_auth:
 username: root
 password: 1230456
 static_configs:
 - targets:
 - 192.168.211.2:8090
其中,我的spring boot服务部署在192.168.211.2上,而prometheus和grafana都部署在192.168.211.101上
配置了两个服务
执行以下命令启动 ./prometheus --config.file=prometheus.yml &
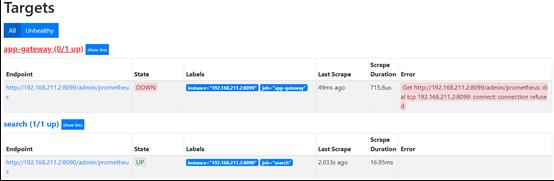
访问http://192.168.211.101:9090/targets
可以看到
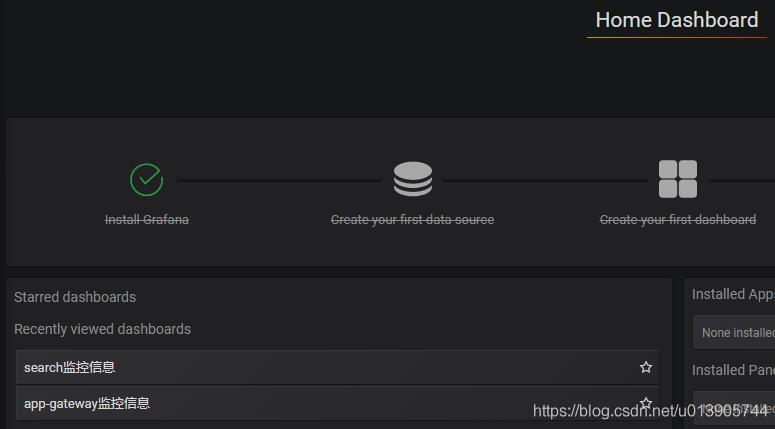
5. grafana可视化监控多个prometheus targets
下载grafana-6.2.5.linux-amd64.tar.gz
启动grafana
./grafana-server &
http://192.168.211.101:3000
在dashboard中配置时,要采用这样的方式
jvm_gc_pause_seconds_count{action="end of minor GC",cause="Metadata GC Threshold",instance="192.168.211.2:8090",job="search"}
通过instance和job来进行区分prometheus的targets
可以看到dashboard中有两个prometheus的targets
以上为个人经验,希望能给大家一个参考,也希望大家多多支持自学编程网。如有错误或未考虑完全的地方,望不吝赐教。

- 本文固定链接: https://zxbcw.cn/post/206634/
- 转载请注明:必须在正文中标注并保留原文链接
- QQ群: PHP高手阵营官方总群(344148542)
- QQ群: Yii2.0开发(304864863)