
2021
05-25
05-25
matplotlib之pyplot模块实现添加子图subplot的使用
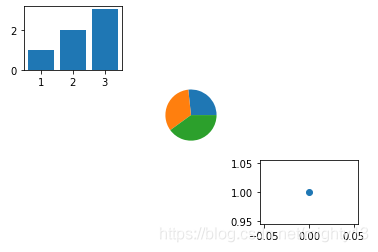 概述subplot()函数向当前图像(figure)添加一个子图(Axes),并将该子图设为当前子图。或者将某子图设为当前子图。pyplot.subplot()其实是Figure.add_subplot()的一个封装。函数的定义签名为:matplotlib.pyplot.subplot(*args,**kwargs)函数的调用签名为:subplot(nrows,ncols,index,**kwargs)subplot(pos,**kwargs)subplot(**kwargs)subplot(ax)函数的参数为:*args:定义子图的位置。int、(int,int,i...
继续阅读 >
概述subplot()函数向当前图像(figure)添加一个子图(Axes),并将该子图设为当前子图。或者将某子图设为当前子图。pyplot.subplot()其实是Figure.add_subplot()的一个封装。函数的定义签名为:matplotlib.pyplot.subplot(*args,**kwargs)函数的调用签名为:subplot(nrows,ncols,index,**kwargs)subplot(pos,**kwargs)subplot(**kwargs)subplot(ax)函数的参数为:*args:定义子图的位置。int、(int,int,i...
继续阅读 >
 python中画图的库有很多,Matplotlib画2D图像是个不错的选择。Matplotlib.pyplot中有很多种函数,今天就为大家简单介绍。绘制坐标图:plt.plot(x,y,fmt,…)箱形图:plt.boxplot(data,notch,position)条形图:plt.bar(left,height,width,bottom)极坐标图:plt.polar(theta,r)饼图:plt.pie(data,explode)功率谱密度图:plt.psd(x,NFFT=256,pad_to,Fs)谱图:plt.specgram(x,NFFT=256,pad_to,F)X-Y的相关性函数:plt.c...
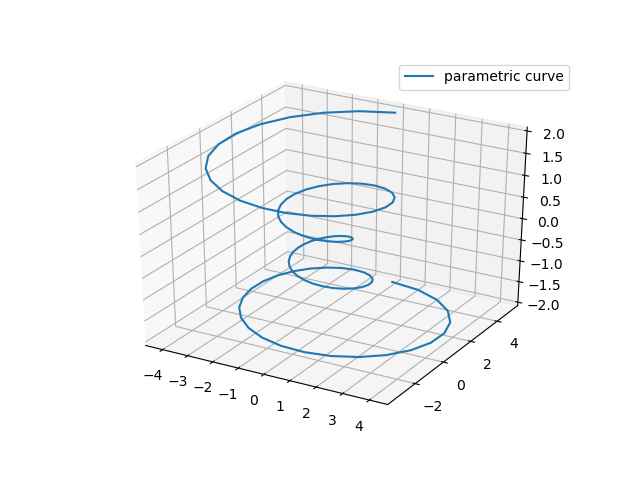 折线图Axes3D.plot(xs,ys,*args,**kwargs)ArgumentDescriptionxs, ysx,ycoordinatesofverticeszszvalue(s),eitheroneforallpointsoroneforeachpoint.zdirWhichdirectiontouseasz(‘x',‘y'or‘z')whenplottinga2Dset.importmatplotlibasmplfrommpl_toolkits.mplot3dimportAxes3Dimportnumpy...
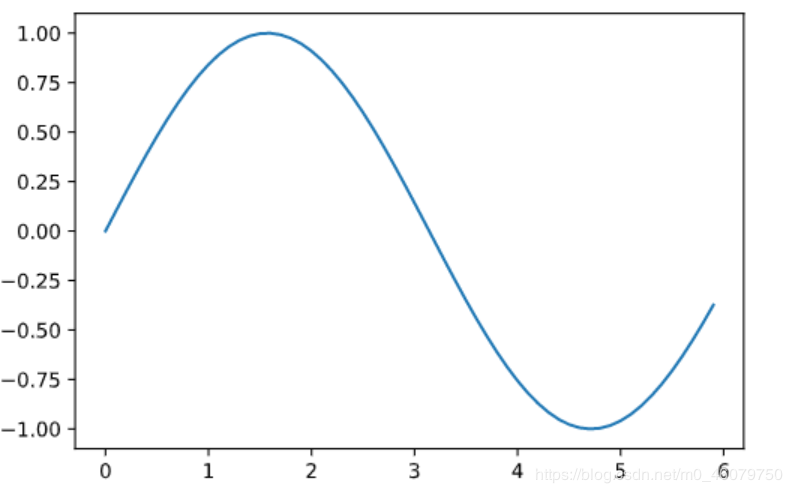 1.绘制简单图形使用matplotlib的pyplot模块绘制图形。看一个绘制sin函数曲线的例子。importmatplotlib.pyplotaspltimportnumpyasnp#生成数据x=np.arange(0,6,0.1)#以0.1为单位,生成0到6的数据*y=np.sin(x)#绘制图形plt.plot(x,y)plt.show()这里使用NumPy的arange()方法生成了[0,0.1,0.2,…,5.8,5.9]的数据,将其设为x。对x的各个元素,应用NumPy的sin函数np.sin(),将x、y的数据传给plt.plot方法...
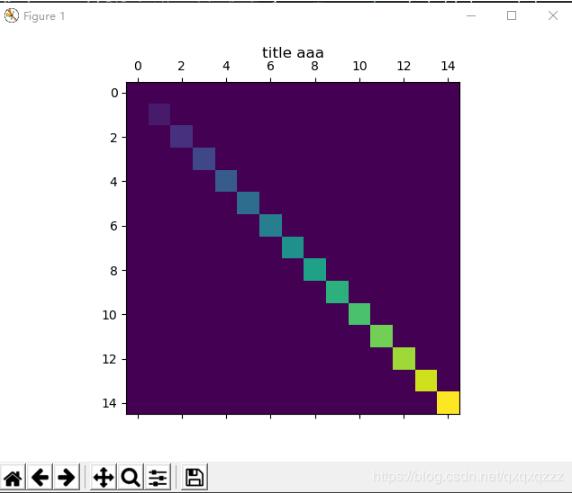 仅供参考importmatplotlib.pyplotaspltimportnumpyasnpdefsamplemat(dims):"""Makeamatrixwithallzerosandincreasingelementsonthediagonal"""aa=np.zeros(dims)foriinrange(min(dims)):aa[i,i]=ireturnaafig=plt.figure()ax=fig.add_subplot(111)plt.title('titleaaa')ax.matshow(samplemat((15,15)),cmap='viridis')plt.show()补充知识:给某数组a通过plt.matshow(a)方法得到的热图h...
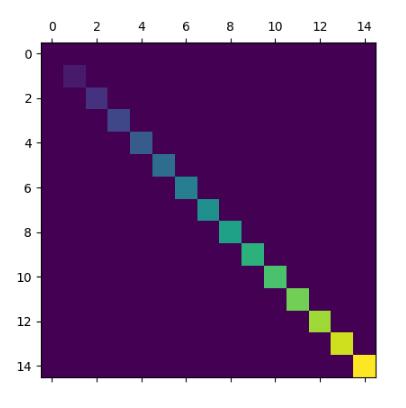 这是一个绘制矩阵的函数。用matshow绘制矩阵的例子:importmatplotlib.pyplotaspltimportnumpyasnpdefsamplemat(dims):"""Makeamatrixwithallzerosandincreasingelementsonthediagonal"""aa=np.zeros(dims)foriinrange(min(dims)):aa[i,i]=ireturnaa#Displaymatrixplt.matshow(samplemat((15,15)))plt.show()效果图:补充知识:利用matplotlib将矩阵画成三维图importcv2ascvimportnum...
 ThisapplicationfailedtostartbecauseitcouldnotfindorloadtheQtplatformplugin“windows”in”“.百度谷歌了好久都没能解决这个问题都没能解决开始我以为是缺少windows这个包,但是代码里并没有用到,所以我打断点去看代码到底问题出在哪里发现问题出在matplotlib上面,我猜想是Qt和matplotlib版本不兼容导致的,于是我卸载了这两个插件并重新安装condauninstallqtcondauninstallmatplotlibcondainstall...